


Three months ago, a biotech PMO director showed me their "strategic alignment framework." Fifteen slides of nested objectives, color-coded initiatives, and arrows connecting everything to everything. Their CFO's response? "I still can't tell which projects actually drive our market expansion goal."
This disconnect happens constantly. Leadership sets aggressive targets. PMO creates elaborate frameworks. Projects get funded based on whoever argues loudest in steering committees. Meanwhile, the actual strategic objectives drift further from daily execution with each funding cycle.
After building portfolio management systems across industries—from 12-person startups to 500-project enterprises—the pattern becomes pretty obvious. The problem isn't strategy. It's not even project selection. It's the operational machinery that converts strategic intent into funding decisions. Most PMOs treat this as a governance exercise when it's actually a workflow problem.
Why portfolio OKRs fail before they start
The typical PMO portfolio OKRs setup looks reasonable on paper. Company objective flows to key results. Key results map to initiatives. Initiatives become projects. Projects request funding. Clean cascade, right?
Except operational reality destroys this hierarchy almost immediately.
A manufacturing PMO I worked with had beautiful OKR alignment charts. Their "reduce production defects by 40%" objective linked to seventeen different projects. But when budget season arrived, finance couldn't figure out which projects actually mattered for that goal. Some projects claimed 80% alignment. Others said 20%. Nobody could prove either number.
The funding committee ended up approving projects based on presentation quality and political capital. Six months later, defect rates barely moved despite $2.3M in "aligned" project spending.
This breakdown happens because most PMOs confuse documentation with operation. They document how things should align but don't build the mechanics that enforce alignment during actual funding decisions.
Strategic objectives get interpreted differently by every project manager. One person's "customer satisfaction improvement" is another's "reduce support tickets." Without operational definitions and measurement protocols, portfolio OKRs become expensive wish lists.
Even worse, alignment usually happens in January, but funding decisions happen quarterly or monthly. By March, that careful January alignment is already outdated—but projects keep claiming alignment to objectives that shifted two months ago.
The weighted scorecard trap that kills strategic projects
So PMOs realize they have an alignment problem and implement weighted scorecards. Strategic fit gets 40% weight. ROI gets 30%. Risk gets 20%. Resource availability gets 10%. Now every project can be scored objectively.
Stop losing track of critical projects.
GoProjy helps you monitor, prioritize, and deliver projects on time—seamlessly.
- Unified portfolio visibility
- Real-time resource tracking
- Milestone & risk alerts
No credit card required
Except this mathematical precision creates new problems.
Strategic projects—genuinely transformative initiatives that take eighteen months and uncertain paths—score terribly on these frameworks. They have fuzzy ROI, high risk, need scarce resources. Meanwhile, incremental improvements with clear three-month paybacks score perfectly.
A healthcare system PMO showed me their scorecard results last year. Highest-scoring projects? Printer replacements, parking lot repairs, and an email migration. Their strategic initiative to build an integrated patient data platform? Ranked 47th out of 52 projects.
The COO looked at those rankings and said, "This can't be right. That data platform is our entire digital strategy." But the scorecard math was correct. The framework was working exactly as designed—prioritizing safe, predictable work over strategic transformation.
Many PMOs respond with "strategic override" provisions. Executives can bypass scorecard rankings for strategic projects. Sounds reasonable until you realize it destroys the entire point of systematic portfolio management. Now you're back to whoever argues loudest in the room, just with extra spreadsheet theater.
The weighting problem gets worse at scale. When you're comparing 200 projects across eight business units, those percentage weights become meaningless. Is a 73.2 score in manufacturing really better than a 71.8 score in digital? The false precision makes funding committees feel scientific while making fundamentally arbitrary decisions.
Building the OKR translation layer
The solution isn't better scorecards or tighter governance. It's building operational translation mechanisms between strategy and funding—systematic ways to convert fuzzy strategic intent into concrete funding criteria.
Start with bounded strategic allocation. Instead of scoring every project against every objective, pre-allocate portfolio percentages to strategic themes. If market expansion is 30% of company strategy, roughly 30% of the project portfolio should support market expansion. Not exactly 30%—that's false precision. Somewhere between 25% and 35%.
This sounds simple but requires real operational machinery. You need objective coding protocols so projects can't claim fake alignment. You need quarterly rebalancing triggers when allocation drifts beyond bounds. You need exception handling for critical projects that legitimately serve multiple objectives.
Create objective coding protocols so projects can't claim fake alignment.
A financial services PMO implemented this after years of scorecard frustration. They established five strategic themes with portfolio allocation ranges:
-
Customer experience
20–25%
-
Operational efficiency
25–30%
-
Regulatory compliance
15–20%
-
Innovation
15–20%
-
Infrastructure
15–20%
Projects now compete within strategic buckets, not across them. A compliance project doesn't need to out-score an innovation project—it needs to be the best compliance project. This immediately solved their problem of boring-but-critical projects losing to flashier initiatives.
But allocation is just the start. You also need outcome-based funding gates. Instead of funding entire projects upfront based on promised alignment, fund phases based on demonstrated contribution to OKRs. Project claims it'll improve customer retention? Fund the pilot. Measure actual retention impact. Then fund the expansion.
This requires different financial workflows than most organizations run. Traditional project funding is binary—approved or rejected. Outcome-based funding is graduated—prove value, get more resources. High-growth PMOs understand this scaling dynamic, building their operations to handle graduated funding from day one.
The operational challenge is creating measurement protocols that actually work. You can't wait eighteen months to measure strategic impact. You need leading indicators, proxy metrics, and staged success criteria that show whether a project is tracking toward strategic goals.
Below is a rough picture of how strategy flows into funded work when the translation layer is actually operational:
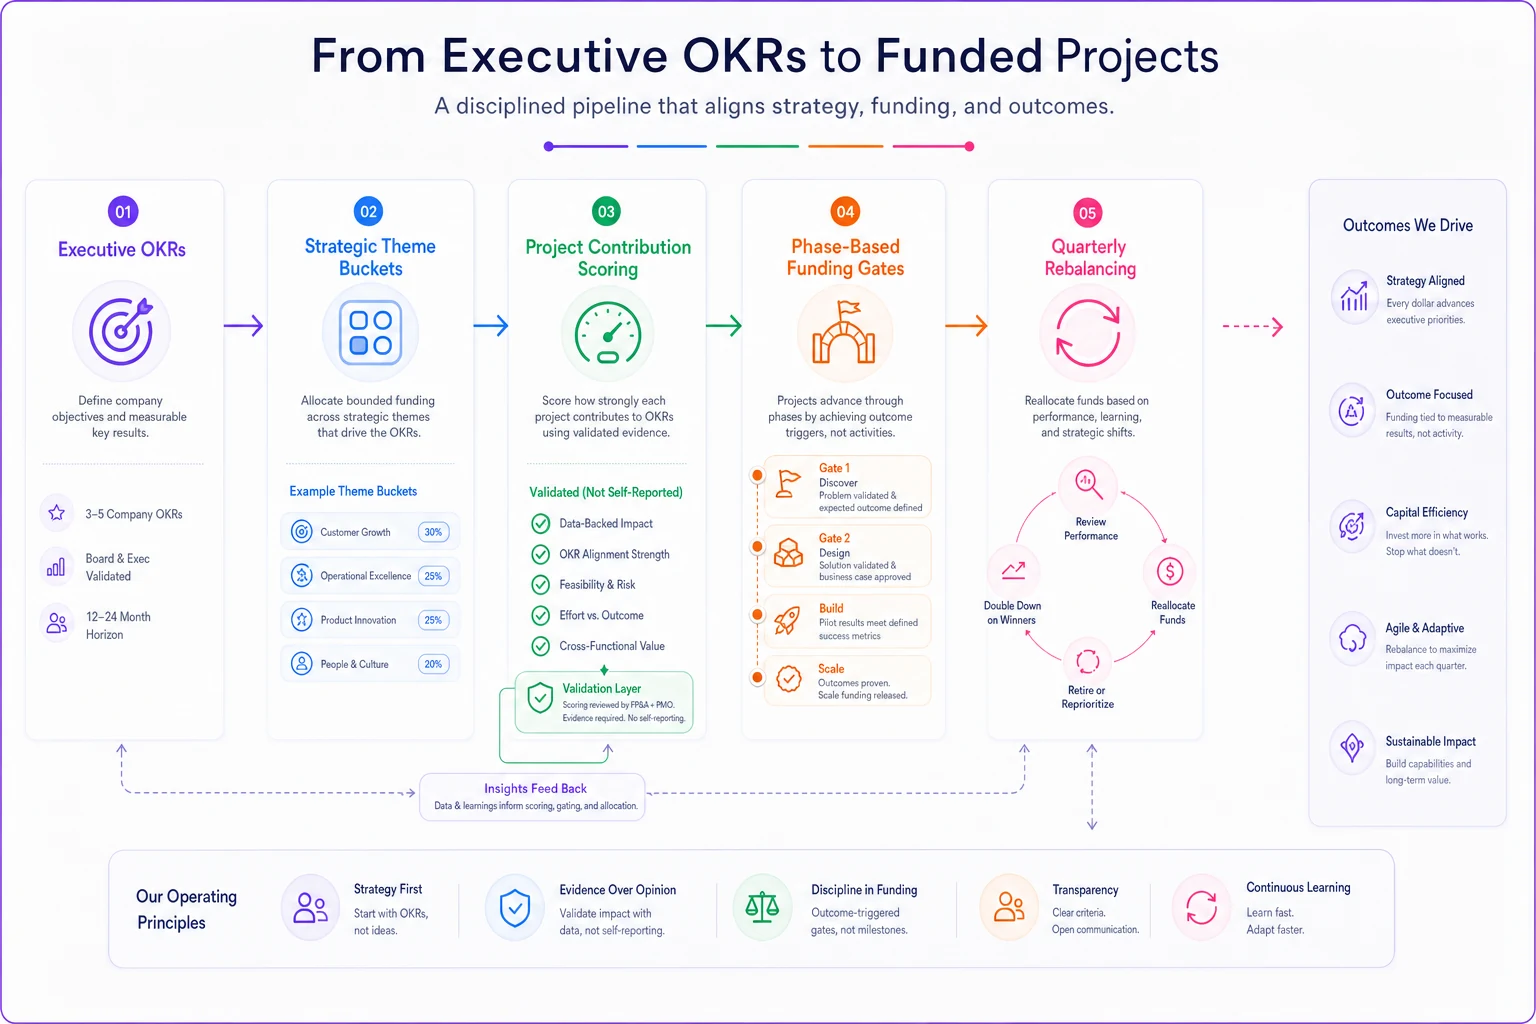
It's not glamorous. But that sequence is what separates PMOs that deliver strategic results from ones that produce well-documented failures.
Weighted scorecards that actually weight strategic value
Traditional weighted scorecards fail because they weight criteria, not outcomes. They score how well a project fits predetermined categories rather than how much it actually contributes to strategic objectives.
A better approach: weight the strategic outcomes themselves, then score project contribution to those weighted outcomes.
Operationally, it works like this. The executive team assigns relative importance to strategic outcomes for the next planning period. Growing market share might be weight 100. Improving margins might be weight 60. Reducing operational risk might be weight 40.
Projects then estimate their contribution to each weighted outcome—not binary yes/no alignment, but scaled contribution. A project might contribute 8/10 to market share, 2/10 to margins, and 0/10 to risk reduction. Its weighted strategic score becomes (8×100) + (2×60) + (0×40) = 920.
Looks like the same math with extra steps, but the operational difference matters. Now projects compete on total strategic value delivery, not artificial category scores. A project that moderately contributes to your most important objective beats one that perfectly delivers a minor objective.
The hard part is making contribution scores real, not fantasy. This requires validation protocols. Project claims 8/10 contribution to market share? They need to show specific market share metrics they'll impact, baseline measurements, projected improvements, and measurement methodology.
A software company PMO built this validation into their quarterly planning workflow. Projects submit contribution claims with supporting evidence. PMO validates claims against historical delivery performance. Inflated claims get adjusted down. After two quarters, project managers figured out that realistic scores got approved faster than optimistic ones.
The validation step seems like overhead but saves massive downstream work. When funding committees review projects, they're comparing validated strategic contributions, not marketing pitches. Decisions happen faster with less political maneuvering.
Review cadences that keep strategy and funding synchronized
Most PMOs run annual strategy sessions, quarterly portfolio reviews, and monthly project updates. These mismatched cadences guarantee strategic drift. Strategy evolves faster than annual cycles but slower than monthly updates. Projects need funding between quarterly reviews.
The fix isn't more meetings. It's synchronized operational cadences with clear decision outputs.
Monthly strategic pulse checks track whether key results are actually moving. Not full strategy reviews—just quick validation that strategic assumptions still hold. Market conditions changed? Competitor moved? Flag it for next quarterly review.
Quarterly portfolio rebalancing adjusts funding based on strategic performance and drift. Not zero-based budgeting—that's too disruptive. Marginal reallocation. Bottom 10% of strategic performers lose around 20% of forward funding. Top 10% get that reallocation. This reallocation approach needs clear triggers and boundaries to prevent it from becoming chaos.
Between quarterly cycles, you need weekly funding windows for emerging opportunities. Not every funding decision can wait three months. But ad-hoc approvals destroy portfolio discipline. One solution: reserve roughly 15% of quarterly allocation for inter-quarter opportunities, with clear criteria for what qualifies and a fast-track approval process. Anything approved this way automatically reduces next quarter's allocation.
This synchronized cadence requires different operational infrastructure than most PMOs have. Rolling forecasts instead of annual budgets. Dynamic allocation tracking instead of static spreadsheets. Real-time strategic performance visibility instead of quarterly reports.
A retail company's PMO learned this the hard way. They had perfect annual alignment but couldn't respond when consumer behavior shifted dramatically mid-year. By the time their next planning cycle arrived, competitors had already captured the emerging market. They rebuilt their portfolio operations around monthly strategic tracking and quarterly reallocation. Now they can pivot portfolio investment within about 30 days of detecting a strategic shift.
Funding artifacts that actually get funded
Every PMO has templates for project charters, business cases, and funding requests. Most are twelve-page documents that nobody fully reads. Funding committees skim the executive summary and make decisions based on presentations, not documents.
Instead of comprehensive documentation, build focused funding artifacts that directly answer funding questions. Decision tools, not project management documents.
The strategic impact certificate: One page showing validated contribution scores to weighted objectives. No narrative, just scored impact with evidence links. Executives can compare five projects in thirty seconds.
The resource commitment map: A visual showing which shared resources this project needs, when, and what happens if they're unavailable. Stops the problem of approving projects without checking resource conflicts.
The outcome trajectory chart: A graph showing expected strategic metric movement over time with confidence bands. Makes it obvious whether a project delivers value in three months or three years.
The funding release triggers: Specific conditions that release the next funding tranche. Not vague milestones like "complete design phase" but measurable outcomes like "achieve 15% pilot adoption rate."
These artifacts work because they answer the actual questions funding committees ask. Not "is this a good project?" but "does this deliver our strategic priorities better than alternatives?"
Building them requires different skills than traditional business case writing—less narrative persuasion, more operational precision. Project managers initially resist the format constraints, then realize focused artifacts get approved faster.
An infrastructure company PMO replaced their 15-page business case template with four focused artifacts. Approval time dropped from around six weeks to roughly two. More importantly, approved projects actually delivered promised strategic value closer to 73% of the time, up from around 40% with traditional business cases.
Here's a rough comparison of the two approaches:
| Artifact Type | Avg. Approval Time | Strategic Delivery Rate |
|---|---|---|
| Traditional 15-page business case | ~6 weeks | ~40% |
| Four focused funding artifacts | ~2 weeks | ~73% |
The numbers won't be identical in every organization, but the directional shift holds up consistently across the PMOs I've seen make this switch.
When portfolio OKRs become operational reality
The transformation from theoretical framework to operational system happens gradually, then suddenly. For months you're building infrastructure, training people, adjusting workflows. Then one day a funding committee actually uses strategic contribution scores to make decisions. Projects start self-selecting out when they realize they don't have real strategic alignment. Resource conflicts get spotted before they cause delays.
A technology PMO spent about eight months building their portfolio OKR operations. In the ninth month, they handled a major strategy pivot—from growth to profitability—by reallocating $4M in project funding within two weeks. No drama, no politics. Systematic rebalancing based on updated strategic weights.
That's when you know it's working. Not when every project aligns perfectly—that never happens. But when strategic changes flow smoothly into funding changes, and funding changes drive different project outcomes.
The thing most PMOs miss: portfolio OKRs aren't about documentation or governance. They're about creating workflows that make strategic alignment the path of least resistance. When it's easier to align with strategy than fight it, when funding flows naturally to strategic priorities, when project managers seek strategic validation before requesting funds—that's when portfolio management actually works.
Most PMOs keep trying to perfect their frameworks, add governance layers, tighten templates. But strategic alignment isn't a framework problem. It's a workflow problem. Build the operational machinery that connects strategy to funding, and the alignment follows.
The difference shows up in results. PMOs with operational portfolio OKR systems tend to deliver somewhere around 60% of their strategic objectives. Traditional PMOs deliver closer to 30%. Not because they have better strategies or smarter people, but because they built the infrastructure that turns strategic intent into funded reality.
Ready to elevate your project delivery?
Join over 2,500 project teams using GoProjy to optimize resources, reduce risks, and drive portfolio success.