



Most PMOs don't have a technical debt problem. They have a technical debt visibility problem. The debt exists, everyone kind of knows it's there, and yet it never makes it onto a funding slate because it can't compete with features that have a business case attached. So it sits. It compounds. And then one quarter it stops being invisible because a release slips or an outage traces back to something a team flagged eighteen months ago.
The reason technical debt loses the funding fight is pretty simple: features come with a number, and debt usually comes with a feeling. "This is getting risky." "The team is frustrated." "We're slowing down." None of that survives contact with a portfolio review where every other request has a projected return.
So the fix isn't a better argument. It's a scoring matrix that forces debt into the same numeric language everything else uses — and maps each item to a funding slot the portfolio actually has. This post walks through how to build that matrix, what the dimensions should be, and how to avoid the traps that make debt scoring collapse into theater.
Why debt never wins the funding fight
There's a pattern that plays out in almost every portfolio that doesn't score debt explicitly.
A platform team raises a concern about an aging authentication service. It's brittle, one person understands it, and every change takes twice as long as it should. They ask for four weeks to refactor it. In the funding review, that request lands next to a customer-facing feature with a projected revenue lift and a sales team pushing for it. The refactor has no revenue number. It has no deadline. It loses. Every quarter, for the same reason.
The deeper issue is that debt requests are almost always framed around cause ("this code is bad") instead of impact ("this is what it costs us and what happens if we wait"). Cause-based framing is easy to defer because there's no consequence attached to waiting. Impact-based framing is much harder to ignore.
Portfolios that eventually got this right stopped treating debt as a category of work and started treating it as a category of risk with a price tag. That shift is what the matrix operationalizes.
The four dimensions that actually matter
You could score technical debt on twenty dimensions. Don't. The moment scoring takes longer than the conversation it replaces, teams abandon it. Four dimensions cover the vast majority of real decisions:
Stop losing track of critical projects.
GoProjy helps you monitor, prioritize, and deliver projects on time—seamlessly.
- Unified portfolio visibility
- Real-time resource tracking
- Milestone & risk alerts
No credit card required
User impact — How much does this debt degrade the experience or reliability that customers or internal users actually feel? Some debt is invisible to users for years. Some is silently eating conversion or causing intermittent failures nobody's tied back to a root cause yet.
Delivery risk — How much does this debt slow down or endanger future work? This is the "tax" dimension. Debt in a hot area of the codebase — the part you touch every sprint — carries a far higher delivery risk than debt in a module nobody's opened in two years.
Cost-to-fix — Rough effort to remediate, in person-weeks. Not a precise estimate. A band is fine, and honestly better, because false precision here is worse than an honest range.
Required funding slot — This is the dimension most matrices skip, and it's the one that makes the whole thing usable. Not every fix fits the same funding mechanism. Some can ride along inside normal sprint capacity. Some need a dedicated slot. Some are big enough to need their own line in the portfolio slate. If you score impact and risk but never map to how it gets funded, the matrix produces a ranked list that still can't be actioned.
The insight most people miss: the first three dimensions tell you whether to fix something, but the funding slot tells you how it competes. A high-impact item that fits inside normal capacity shouldn't be fighting for a portfolio line at all — it should just get done. Conflating those two decisions is why so many debt backlogs stall.
Scoring the dimensions without turning it into a research project
Keep each dimension on a tight scale. We use 1–5 for the first two, effort bands for cost, and a discrete category for the funding slot. Here's the working reference:
| Dimension | Scale | What each end means |
|---|---|---|
| User impact | 1–5 | 1 = invisible to users; 5 = actively degrading reliability or experience now |
| Delivery risk | 1–5 | 1 = cold code, rarely touched; 5 = blocks or slows near-term roadmap work |
| Cost-to-fix | Effort band | S (< 1 wk), M (1–3 wks), L (3–8 wks), XL (8+ wks) |
| Funding slot | Category | Sprint-absorbable / Dedicated allocation / Portfolio line item |
The scoring formula stays deliberately simple. Rank primarily on (user impact + delivery risk), then use cost-to-fix to break ties and sequence, and use the funding slot to route the item to the right decision forum.
That ordering matters. If you multiply impact by cost, or build a weighted composite with six factors, you get a single number that nobody trusts and nobody can explain in a review. A two-factor priority score plus a cost tiebreaker plus a routing category survives the "why is this ranked here?" question every time.
One pattern worth calling out: teams consistently overrate user impact and underrate delivery risk.
Delivery risk is the sneaky one, because its cost shows up as a slow leak across every future estimate rather than a single visible failure. When you're reviewing scores, push hardest on the delivery-risk column.
Here's a quick workflow for how scoring flows into funding decisions.
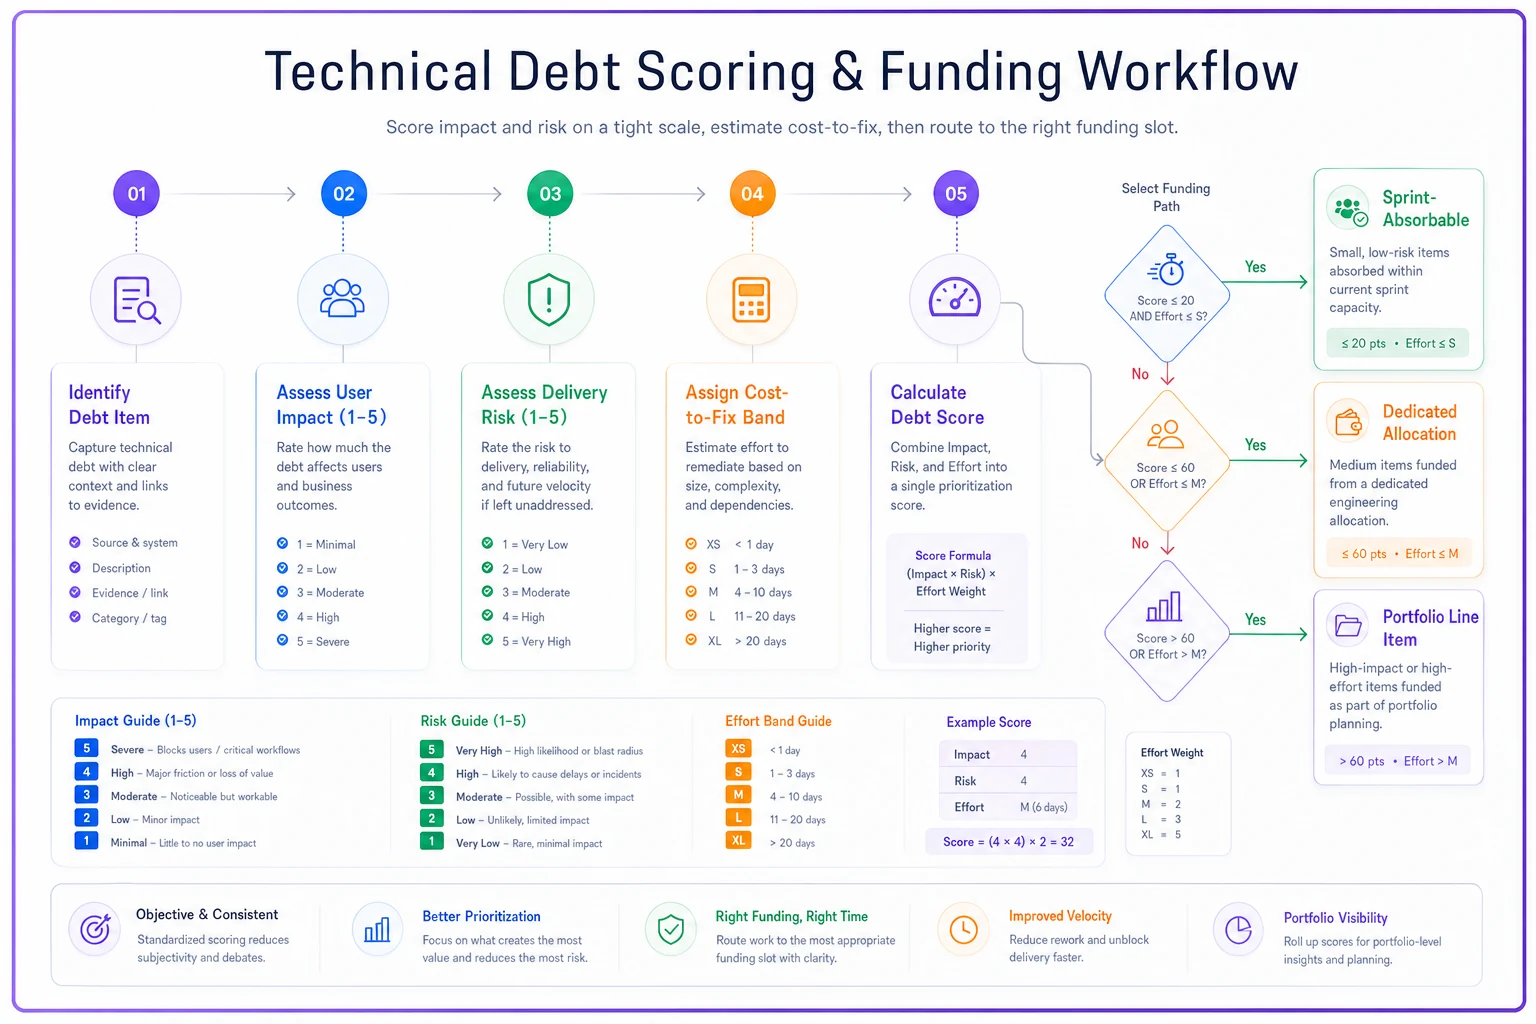
One pattern worth calling out: teams consistently overrate user impact and underrate delivery risk. Delivery risk is the sneaky one, because its cost shows up as a slow leak across every future estimate rather than a single visible failure. When you're reviewing scores, push hardest on the delivery-risk column.
A worked example
Say a mid-sized product portfolio has these five debt items on the table going into a quarterly funding review:
-
Auth service refactor — user impact 2, delivery risk 5, cost L, slot: dedicated allocation
-
Legacy reporting queries — user impact 4, delivery risk 2, cost M, slot: sprint-absorbable
-
Flaky checkout retry logic — user impact 5, delivery risk 3, cost S, slot: sprint-absorbable
-
Monolith payments extraction — user impact 3, delivery risk 4, cost XL, slot: portfolio line item
-
Deprecated logging library — user impact 1, delivery risk 2, cost M, slot: sprint-absorbable
Rank by impact + risk: checkout retry (8), auth refactor (7), payments extraction (7), reporting queries (6), logging (3).
Now route by funding slot, and the picture gets actionable in a way a flat ranked list never does.
The checkout fix scores highest and is sprint-absorbable at S effort — so it shouldn't be in the funding review at all. It just gets pulled into the next sprint. That's the most common realization when portfolios first run this exercise: a chunk of their "we need funding for debt" list was never a funding problem. It was a prioritization-inside-teams problem.
The auth refactor and payments extraction both score 7, but they compete in completely different arenas. The auth work needs a dedicated allocation — a protected slice of a team's capacity for a quarter. The payments extraction is an XL portfolio line item that goes head-to-head with feature investments and needs an actual business case built around the delivery-risk tax it's removing. Same priority score, totally different funding conversation.
Reporting queries and the logging library ride along in normal capacity when there's slack, with logging effectively parked until it's cheap to do alongside adjacent work.
The point isn't the exact numbers. It's that the funding-slot dimension split five items into three different decision paths automatically, instead of dumping all five into one impossible "which do we fund?" debate.
Where this connects to the broader portfolio
Debt scoring doesn't live in isolation. The delivery-risk dimension is really a leading indicator of the same problem you're already fighting elsewhere — capacity that quietly evaporates. High delivery-risk debt is one of the biggest hidden drains on throughput, which is why it belongs in the same conversation as your capacity and demand management system. If a team's velocity is dropping and you can't explain it, unscored delivery-risk debt is a prime suspect.
Similarly, how well this matrix actually sticks depends heavily on your operating model. Portfolios that treat debt as a first-class funded category tend to be the ones that already got their operating-model foundations right — the same disciplines covered in what high-growth PMOs get right as they scale. Without that foundation, the matrix becomes a spreadsheet nobody updates.
Keeping the scores honest over time
The biggest failure mode isn't building the matrix — it's letting it rot. Scores get set once during a big cleanup effort and then never revisited, so within two quarters the rankings reflect a portfolio that no longer exists.
A few operational rules keep it alive:
-
Rescore delivery risk when the roadmap shifts. Debt in a module doesn't change, but whether that module is on the near-term roadmap changes constantly. A cold item can become hot overnight when a new initiative lands on top of it.
-
Cap the active list. If you're tracking more than 20–30 scored debt items, the list has become a graveyard. Force the low scorers into an explicit "accepted debt" bucket — decisions you've consciously made not to fix — rather than pretending they're still candidates.
-
Attach an owner to every item scored 4+ on either impact or risk. Unowned high-score items are how debt slides back into invisibility.
-
Review the accepted-debt bucket quarterly. Not to fix it — to confirm you still accept it. Sometimes an item you parked has drifted into dangerous territory.
-
Log the score history. When something breaks, being able to show it was scored a 2 six months ago and a 5 last month is far more useful than any postmortem theory.
That last point matters more than it sounds. The value of a scoring matrix compounds when you can see how items moved, not just where they sit today.
When this approach makes sense — and when it doesn't
This makes sense when you have a real portfolio with competing funding demands, multiple teams generating debt, and a governance forum that decides allocation. The matrix earns its keep by translating debt into the language that forum already speaks.
This is overkill when you're a single team with one backlog. If everything you fund flows through one board, you don't need a portfolio-level scoring matrix — you need decent backlog hygiene. Adding the funding-slot dimension when there's only one funding slot is pure overhead.
Who should be careful with this: organizations that will use the scores as a weapon rather than a lens. If leadership starts using the delivery-risk column to blame teams for accumulating debt, teams will quietly stop surfacing it, and you'll be worse off than when the debt was merely invisible. The matrix works only in cultures where surfacing debt is rewarded, not punished. That's less a scoring problem than a governance one, but it kills more matrices than any modeling mistake.
A short real scenario
A B2B software group running around 40 active initiatives kept losing the debt argument every quarter. Their platform team had flagged a data-layer bottleneck three quarters running; it never got funded because it had no revenue story.
They introduced the four-dimension matrix mostly to end the recurring fight. Scoring the data-layer item honestly put it at user impact 3, delivery risk 5 — the highest combined score on the board — with an L cost and a dedicated allocation funding slot.
The reframing did the work. Instead of "the code is bad," the case became "this is the single highest delivery-risk item in the portfolio, and it's taxing roughly a third of our roadmap." It got a protected two-team allocation for a quarter. Over the following two quarters, estimates in that area tightened noticeably and a category of intermittent incidents largely disappeared.
The more interesting outcome was quieter: about a third of their existing debt "backlog" turned out to be sprint-absorbable items that had been miscategorized as funding requests. Those just got scheduled. The funding review shrank to the handful of items that genuinely needed portfolio-level decisions — which is exactly what a funding review should be.
The real point
Technical debt doesn't get deprioritized because leaders don't care about it. It gets deprioritized because it shows up to a numeric fight without a number. A scoring matrix that maps each item to user impact, delivery risk, cost-to-fix, and — critically — the funding slot it actually competes in gives debt the same standing as everything else on the slate.
Build it small. Keep the dimensions to four. Let the funding-slot column route items to the right decision instead of dumping everything into one impossible debate. And rescore delivery risk whenever the roadmap moves, because that's the dimension that quietly decides whether your next quarter runs smoothly or spends itself paying interest on decisions nobody remembers making.
Build it small. Keep the dimensions to four. Let the funding-slot column route items to the right decision instead of dumping everything into one impossible debate. And rescore delivery risk whenever the roadmap moves, because that's the dimension that quietly decides whether your next quarter runs smoothly or spends itself paying interest on decisions nobody remembers making.
Ready to elevate your project delivery?
Join over 2,500 project teams using GoProjy to optimize resources, reduce risks, and drive portfolio success.