
Most PMOs track resource allocation on spreadsheets, assign people to projects based on who's available right now, and wonder why everything bottlenecks three weeks later. The real issue isn't your tracking—it's that you're managing capacity at the wrong level of detail and ignoring how work actually flows through your teams.
A marketing agency PMO with 8 project managers and 45 creatives started hitting capacity walls around 20 concurrent projects. Not because they lacked people, but because they never modeled actual skill-level capacity. Their senior designers could handle complex rebrand work while junior designers needed supervision for basic social assets. When you assign work based on "designer availability" without factoring skill levels, senior people get buried in simple tasks while complex projects stall waiting for expertise.
The solution isn't more sophisticated resource charts. It's building a capacity system that models how work actually moves through your organization.
Why traditional resource management breaks at scale
Resource management feels straightforward when you're running 5 projects. You know everyone's workload, can shift priorities in a quick meeting, and personally track who's overwhelmed. This personal oversight model works until somewhere between 15-25 concurrent projects, depending on complexity.
Then the wheels come off. A software consultancy hit this wall at 22 projects. Their PMO lead spent 6 hours weekly just figuring out who was available for new work. Project kickoffs got delayed 8-12 days on average because they couldn't quickly identify which technical architects had capacity. Client escalations increased 3x in four months.
They managed capacity through individual availability instead of systematic capacity pools. Think about how work actually enters your PMO. A new project request comes in needing specific capabilities—maybe UX design, backend development, and QA testing. Traditional resource management asks "who's free?" when it should ask "what's our current capacity for each required skill?"
This distinction matters because availability and capacity aren't the same thing. Your senior architect might be "available" 20 hours next week, but if those hours are fragmented across 6 projects, their effective capacity for complex architecture work is near zero. They're doing project switching and context management, not deep technical work.
Most PMOs discover this problem through pain. Projects start slipping. Quality drops. Your best people burn out while others sit idle. Teams blame poor project management when the real culprit is systematic capacity blindness.
Building a skill-level capacity model that actually works
Forget generic "developer" or "designer" resource pools. Real capacity planning requires mapping actual skill levels against actual work requirements.
Stop losing track of critical projects.
GoProjy helps you monitor, prioritize, and deliver projects on time—seamlessly.
- Unified portfolio visibility
- Real-time resource tracking
- Milestone & risk alerts
No credit card required
-
4 principal engineers (system architecture, technical strategy)
-
8 senior engineers (complex feature development, code reviews)
-
12 mid-level engineers (standard feature development)
-
6 junior engineers (bug fixes, simple features under supervision)
Each level has different capacity characteristics. Principal engineers can effectively handle 2-3 strategic initiatives simultaneously before quality degrades. Senior engineers manage 4-5 feature streams. Juniors need 1:4 supervision ratios from seniors.
Now map your project work the same way. That "simple" mobile app refresh actually requires:
-
40 hours of principal engineer time for architecture decisions
-
200 hours of senior engineer time for complex features
-
400 hours of mid-level work for standard features
-
120 hours of junior work for testing and bug fixes
Suddenly you see why projects stall. You have junior capacity available but you're bottlenecked on senior engineer time. Without this visibility, you keep accepting projects that queue behind the same constrained resources.
The modeling gets more sophisticated when you factor in ramp-up time and context switching. A senior engineer at 80% allocation across 2 projects delivers more than one at 80% across 5 projects. The first scenario allows deep work. The second creates thrash.
| Skill Level | Optimal Concurrent Projects | Context Switch Penalty | Effective Capacity |
|---|---|---|---|
| Principal Engineer | 2-3 strategic initiatives | High (40% loss) | 60% of allocated hours |
| Senior Engineer | 4-5 feature streams | Medium (25% loss) | 75% of allocated hours |
| Mid-level Engineer | 3-4 standard projects | Low (15% loss) | 85% of allocated hours |
| Junior Engineer | 1-2 with supervision | Very Low (5% loss) | 95% of allocated hours |
Some PMOs resist this level of modeling, calling it over-engineering. But every PMO that scales successfully eventually builds some version of this system. The only question is whether you build it proactively or after your thirteenth project crisis.
Rolling horizons beat static planning every time
Annual capacity plans are fantasy documents. Quarterly plans are barely better. PMOs that prevent bottlenecks use rolling horizon planning—continuously updating capacity views based on actual project flow.
Maintain three capacity horizons:
Locked horizon (0-2 weeks): Current sprint or cycle. No changes except emergencies. Teams know exactly what they're delivering.
Planned horizon (3-8 weeks): Confirmed project assignments with specific resource allocations. Changes require PMO approval and impact assessment.
Pipeline horizon (9-16 weeks): Projected capacity based on expected project completions and incoming demand. Continuously adjusted based on actuals.
Automate rolling horizon updates to reflect actual burn rates so problems surface early.
A creative agency PMO using this model caught a major bottleneck six weeks before it would have derailed three client launches. Their pipeline view showed video editing capacity going negative in week 9 when two major campaigns would overlap. They had time to either adjust timelines, bring in contractors, or reallocate work from other projects.
Without rolling horizons, they would have discovered this problem in week 7, when both project teams started requesting the same video editors. By then, client expectations are set, deadlines are public, and your only options are bad ones.
Manual rolling horizons fail because they require too much maintenance. Automated systems work because they update themselves based on actual data, surfacing problems while you still have maneuver room.
The intake handshake that stops garbage from entering your pipeline
Bad project intake kills capacity planning. When projects enter your system without clear requirements, realistic effort estimates, or proper prioritization, every downstream process breaks.
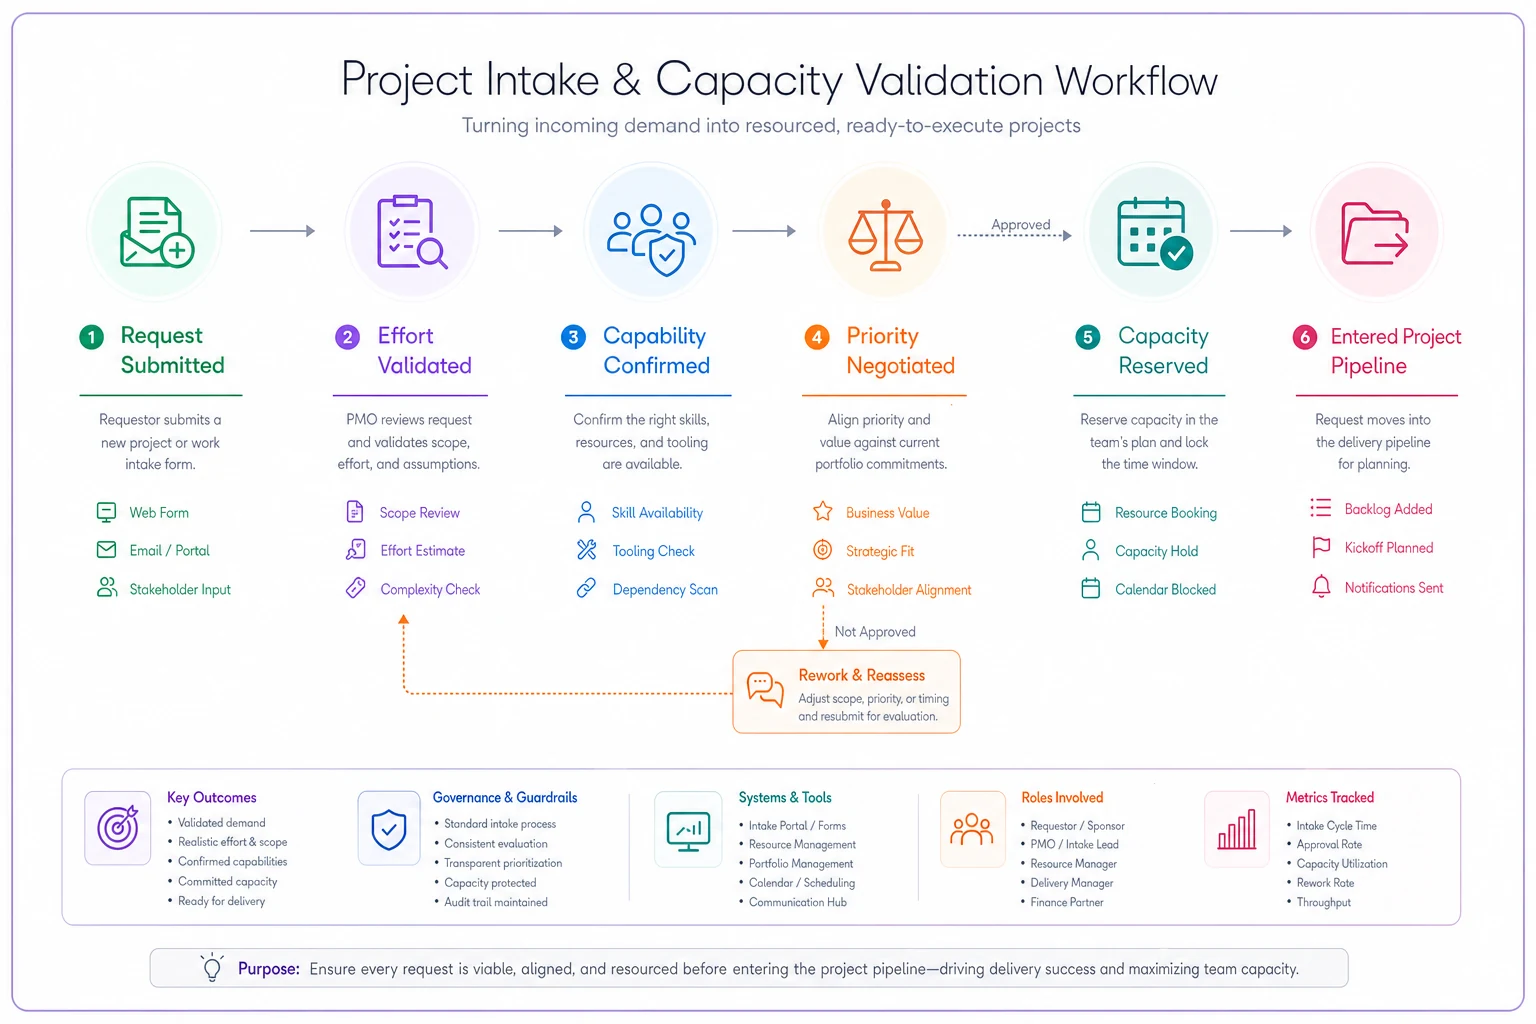
Most intake processes are actually approval processes. Someone fills out a form, it gets reviewed, approved, and thrown into the project queue. That's not intake—that's acceptance of chaos. Real intake requires a handshake between demand and capacity.
-
Effort validation Not just high-level estimates, but skill-specific effort broken down by project phase. A mobile app project might need 40 hours of architecture, 200 hours of senior development, 300 hours of standard development, and 100 hours of QA.
-
Capability confirmation Match required skills against actual team capabilities. That AI integration feature sounds great until you realize your only ML engineer is committed for three months.
-
Priority negotiation New projects don't just get added—they get inserted based on value. This means explicitly identifying what gets pushed out or delayed.
-
Capacity reservation Lock the required capacity before confirming the project. This prevents the common problem of approving five projects that all need the same senior designer next month.
An enterprise PMO running 80+ concurrent projects implemented this handshake system and saw dramatic improvements. Project delays dropped from averaging 3.2 weeks to 0.8 weeks. Resource conflicts decreased by 70%. Teams stopped the constant fire-fighting that comes from overcommitment.
create an image depicting Project intake and capacity validation workflow showing how demand requests flow through effort validation, capability confirmation, priority negotiation, and capacity reservation before entering the project pipeline
The handshake isn't about saying no to projects. It's about saying yes with genuine understanding of the trade-offs. When stakeholders see that accepting their project means delaying another specific initiative, conversations become more productive.
Prioritization inputs that balance strategic value with operational reality
Every PMO claims to prioritize based on business value. In practice, most prioritize based on whoever screams loudest or whatever's most visible to leadership. This isn't a process failure—it's a system design problem.
Strategic alignment score (30% weight): How directly does this project support declared business objectives? A project supporting a board-level initiative scores higher than departmental improvements.
Resource efficiency score (25% weight): Can we deliver this with current capacity or does it require specialized skills, new hires, or significant ramp-up?
Dependency impact score (20% weight): How many other projects depend on this one? Platform improvements that unblock multiple initiatives score higher than standalone projects.
Risk-adjusted value (15% weight): Expected business value multiplied by probability of success. A $1M opportunity with 80% success probability scores higher than a $2M opportunity with 30% probability.
Operational readiness (10% weight): Is the receiving organization ready? Can they absorb the change?
The weights matter less than having explicit factors. When your prioritization model is transparent, stakeholders can influence scores through preparation rather than politics. A financial services PMO implemented this model for their 50+ project portfolio. Instead of monthly priority battles, they had data-driven discussions.
When the compliance team wanted their project accelerated, they could see exactly why it ranked below the customer portal upgrade. More importantly, they could see what would improve their score. This transparency transformed stakeholder behavior from political lobbying to operational preparation.
KPIs that predict bottlenecks before they hit
Most PMO KPIs are retrospective—project completion rates, budget variance, timeline adherence. These tell you what went wrong, not what's about to go wrong.
Predictive capacity KPIs catch problems while you can still fix them:
Skills utilization variance: Track planned vs. actual utilization by skill level. When senior architects consistently log 120% of planned hours, you're heading for burnout or quality problems.
Capacity queue depth: How many projects are waiting for specific resources? When queue depth exceeds 3 weeks for any skill, you have a structural capacity problem.
Assignment fragmentation index: Average number of projects per person per week. When this exceeds 4 for makers (not managers), productivity craters.
Estimate accuracy by phase: Track how much phases overrun by skill type. If architecture phases consistently run 40% over estimate, your capacity model is broken for that skill.
Pipeline coverage ratio: Confirmed capacity for next 8 weeks divided by projected demand. When this drops below 0.8, you're about to hit conflicts.
The power comes from monitoring trends, not absolute values. A marketing agency PMO noticed their senior designer fragmentation index climbing from 3.2 to 5.7 over six weeks. They intervened before the breaking point, consolidating projects and pushing two initiatives out a month.
Some PMOs track 20+ metrics, thinking more data means better control. In practice, 5-7 well-chosen predictive metrics give you enough signal to prevent most capacity crises.
Common failure modes as you scale
PMOs don't fail suddenly. They degrade through predictable stages as project volume increases.
Stage 1 (15-25 projects): Personal oversight breaks. The PMO lead can't track everything mentally anymore. Projects start slipping but nobody knows why. Solution: Implement basic capacity tracking by skill level.
Stage 2 (25-40 projects): Resource conflicts multiply. Every new project seems to need the same people. Firefighting becomes constant. Solution: Build rolling horizon planning and intake handshakes.
Stage 3 (40-60 projects): Prioritization becomes political. Without clear criteria, loudest voice wins. Team morale drops as priorities shift constantly. Solution: Implement transparent prioritization scoring.
Stage 4 (60-80 projects): Coordination overhead explodes. Teams spend more time in alignment meetings than doing work. Solution: Automate capacity management and reporting.
Stage 5 (80+ projects): System breaks completely without automation. Manual tracking can't keep up with rate of change. Solution: Full platform implementation with automated capacity management.
A technology consultancy grew from 20 to 85 projects over 18 months. They hit every one of these stages, implementing fixes reactively after each crisis. The pattern repeats across industries.
Most PMOs recognize the signs but underestimate the complexity of building systematic solutions during crisis mode. The successful ones build capacity management systems before they desperately need them.
The platform implementation path
Manual capacity management works until it doesn't. The breaking point usually arrives between 30-40 concurrent projects, depending on complexity and team size.
The transition doesn't require a big-bang implementation. Start with the highest-pain areas:
Phase 1: Skills inventory and capacity modeling Map your actual skills and build initial capacity models. Even in spreadsheets, this visibility transforms planning discussions.
Phase 2: Automated time and effort tracking Stop relying on manual timesheets and estimates. Pull actual effort data from your project management tools to continuously calibrate capacity models.
Phase 3: Rolling horizon automation Implement tools that automatically recalculate forward capacity based on actual burn rates and project progress.
Phase 4: Integrated intake and prioritization Connect project requests directly to capacity models, showing real-time impact of new projects on existing commitments.
Phase 5: Predictive analytics and optimization Use historical patterns to predict future bottlenecks and automatically suggest optimal resource allocations.
Modern PMO platforms powered by AI automation handle much of this complexity automatically. They track actual vs. planned effort, identify patterns in estimation accuracy, and continuously adjust capacity projections. When a senior developer consistently takes 30% longer than estimated on integration tasks, the system learns and adjusts future capacity planning accordingly.
The automation doesn't replace PMO judgment—it amplifies it. Instead of spending time collecting status updates and recalculating availability, PMOs focus on strategic resource decisions and stakeholder communication.
Making capacity management stick
The best capacity management system means nothing if teams don't follow it. Implementation succeeds or fails based on adoption, and adoption depends on the system making everyone's life easier, not just the PMO's.
Project managers need to see that following the intake process actually protects their projects from resource conflicts. Teams need to experience how realistic capacity planning reduces crunch time and weekend work.
PMOs that succeed make capacity management part of the culture, not a compliance exercise. They celebrate when the system prevents a crisis, not just when projects succeed despite chaos. They reward project managers who surface capacity conflicts early rather than those who heroically overcome them.
A design agency PMO made this shift after their third major project crisis in six months. Instead of praising the team that worked weekends to save a launch, they analyzed why capacity planning would have prevented the crisis entirely. They started measuring project manager performance partially on estimation accuracy and capacity planning effectiveness.
Within four months, their project delivery predictability increased from around 60% on-time to over 85%. More importantly, voluntary overtime dropped by 40% as teams stopped constantly fighting resource conflicts.
The cultural shift takes time but the operational improvements compound quickly. Teams that operate with realistic capacity constraints deliver more predictably than those that operate on optimistic assumptions and heroic effort.
The path forward
Building effective PMO capacity and demand management isn't about perfect resource utilization or elaborate tracking systems. It's about creating visibility into how work actually flows through your organization and building systems that prevent bottlenecks before they form.
Start with skill-level capacity modeling. You can't manage what you can't see, and generic resource pools hide the constraints that actually delay projects. Implement rolling horizons to see problems coming weeks before they hit. Static planning in dynamic environments always fails.
Build intake handshakes that validate capacity before committing to projects. Hope-based planning leads to predictable failure. Create transparent prioritization that balances strategic value with operational reality. Politics-based prioritization destroys team morale and project success.
Track predictive KPIs that show future problems, not just past failures. Retrospective metrics help you write better post-mortems, not prevent crises. Most importantly, recognize that manual capacity management has hard scaling limits. Somewhere between 30-40 projects, you'll need automated systems to maintain visibility and control.
PMOs that scale successfully build these systems before they desperately need them, not after their fifth crisis proves the old way broken. The question isn't whether you need systematic capacity management—it's whether you'll build it proactively or after your next major portfolio bottleneck brings everything to a halt.
Ready to elevate your project delivery?
Join over 2,500 project teams using GoProjy to optimize resources, reduce risks, and drive portfolio success.