

A PMO director showed me their EVM dashboard not long ago. Forty-three projects, each tracking twelve EVM metrics, refreshed weekly. That's 516 data points every Monday morning. Their analysts spent three days building reports, stakeholders spent another day arguing about variances, and by Thursday the data was already stale.
Only four projects actually needed intervention. The other thirty-nine were basically fine—minor variances that would self-correct or weren't worth the overhead to chase. But those four critical projects got buried in spreadsheet rows and variance explanations.
This happens everywhere. PMOs implement textbook EVM because it seems like the responsible thing to do—track everything, measure precisely, report comprehensively. Then reality hits: your team burns roughly 30% of their capacity feeding the EVM machine, executives tune out because reports are too dense, and actual problems slip through because nobody can separate signal from noise.
Why traditional EVM breaks at portfolio scale
The math behind EVM is solid. Cost variance, schedule variance, performance indices—it makes sense for a single project. But portfolios aren't just bigger projects. They're collections of projects with different risk profiles, resource pools, stakeholder groups, and strategic importance. When you try to roll up traditional EVM across a portfolio, three things break pretty fast.
First, data quality varies wildly. Your infrastructure upgrade might have clean timesheets and accurate actuals because it runs through your ERP. Meanwhile, that innovation pilot is tracking costs on sticky notes using a mix of contractors and borrowed internal resources. Rolling these up together gives you an average that represents nothing real.
Second, refresh cycles don't align. Finance closes the books monthly, project managers update schedules weekly, resource managers track utilization daily. By the time you aggregate everything, you're comparing January actuals to February forecasts to March resource plans. The resulting metrics look precise but are basically nonsense.
Third—and this one is the real killer—small variances compound into fake crises. A dozen projects each running 5% over budget doesn't mean your portfolio is 5% over budget. Some might have contingency, others might finish early, a few might get descoped. But traditional EVM aggregation treats every variance as permanent and additive. Suddenly your portfolio looks like it's on fire when it's actually fine.
Building a pragmatic EVM model that actually scales
After watching a lot of PMOs struggle with this, a different approach starts to make sense: limit inputs, define acceptable error bands, and focus on decision triggers rather than comprehensive reporting.
Stop losing track of critical projects.
GoProjy helps you monitor, prioritize, and deliver projects on time—seamlessly.
- Unified portfolio visibility
- Real-time resource tracking
- Milestone & risk alerts
No credit card required
The model starts with input constraints. Each project reports exactly four numbers:
-
Actual cost to date
-
Forecasted cost to complete
-
Actual schedule progress (as a percentage)
-
Forecasted completion date
From there, error bands apply based on project characteristics:
| Project Type | Cost Variance Band | Schedule Variance Band |
|---|---|---|
| Low-risk operational | ±15% | ±2 weeks |
| Medium-risk enhancement | ±20% | ±4 weeks |
| High-risk innovation | ±30% | ±8 weeks |
Anything within those bands doesn't trigger escalation. This immediately eliminates the majority of variance discussions that eat up everyone's time.
The treemap aggregation model that surfaces real issues
Instead of traditional rollup tables, a treemap visualization works much better—projects displayed as rectangles sized by budget and colored by variance severity. The key difference is showing variance trend over the last three periods, not just the current snapshot.
A project consistently running 10% over budget (steady yellow) is less concerning than one that went from green to red in two weeks. The treemap makes these patterns immediately visible. You can see problem clusters forming before they become crises.
The treemap workflow below shows how projects are sized, colored, and trended for aggregation.
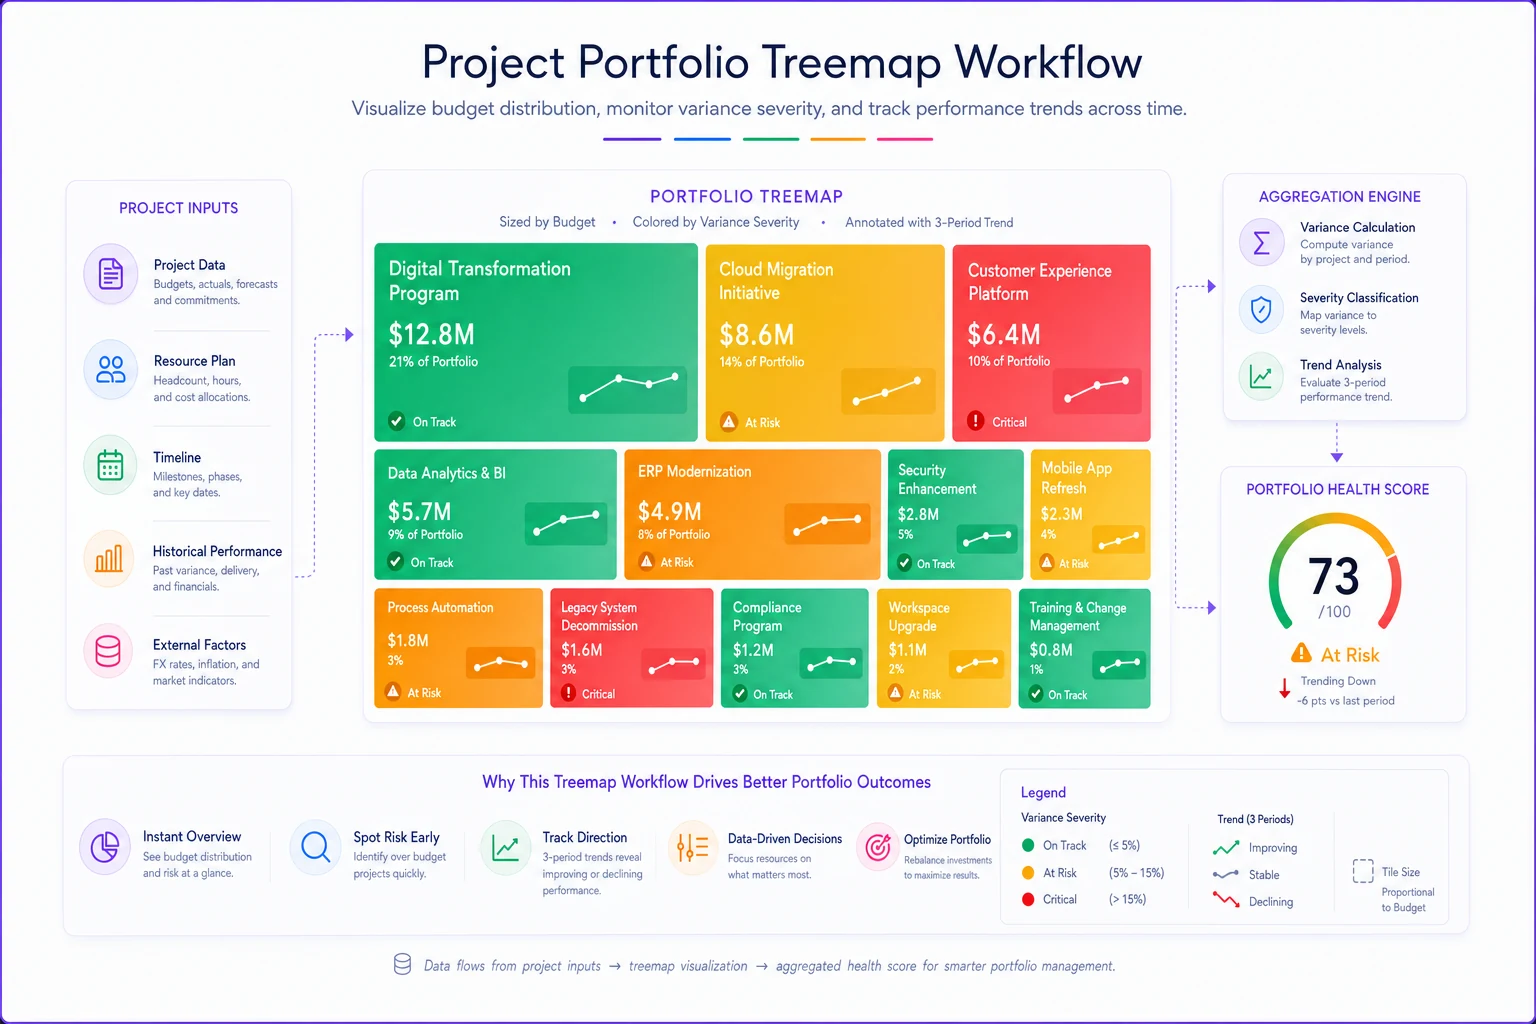
Portfolio health score calculation:
-
Weight each project by strategic value (1–5 scale) multiplied by budget
-
Apply variance penalties only outside error bands
-
Double-weight trending variances (getting worse over time)
-
Triple-weight projects on the critical path
This gives you one number that actually means something. A portfolio health score below 70 needs attention. Below 50 is a crisis. Above 85 and someone's probably sandbagging.
The model is intentionally blunt. It won't win any methodology awards, but it will get used—which is more than you can say for most PMO frameworks that die in a SharePoint folder six months after launch.
Practical decision triggers that prevent analysis paralysis
Immediate escalation triggers:
-
Any project exceeds error bands for two consecutive periods
-
Critical path project shows negative schedule trend
-
Resource conflict affects 3+ projects simultaneously
-
Cumulative portfolio variance exceeds 10% of remaining budget
Review triggers (next governance meeting):
-
Project approaching error band limits
-
Dependency risk identified with upstream project
-
Scope change request exceeds contingency
Monitor only (no action required):
-
Variances within error bands
-
One-time variances with a clear resolution path
-
Projects with sufficient contingency coverage
These triggers connect directly to an early warning system for schedule slippage, which creates a monitoring framework without generating redundant alerts across both systems.
Roll-up rules that respect organizational reality
Traditional EVM assumes you can add up all project metrics and get meaningful portfolio metrics. That ignores how organizations actually work. Different projects have different governance structures, funding sources, and acceptable risk tolerances.
By funding source:
-
CapEx projects
aggregate by fiscal year allocation
-
OpEx projects
aggregate by quarterly budget
-
Innovation funds
track burn rate, not variance
By governance tier:
-
Tier 1 (board-level)
full EVM tracking with monthly executive reviews
-
Tier 2 (division-level)
simplified tracking with quarterly reviews
-
Tier 3 (departmental)
exception-only reporting
By strategic objective:
-
Revenue-generating
focus on schedule variance
-
Cost-saving
focus on benefit realization milestones
-
Compliance
binary tracking (on-track or not)
-
Innovation
track learning velocity, not cost variance
This segmented approach means you're comparing apples to apples instead of mixing everything into a meaningless aggregate. The governance tier distinction matters especially—a departmental project shouldn't need the same reporting overhead as something on the board's radar.
A real implementation that cut reporting overhead significantly
A technology company with 47 active projects was drowning in EVM reporting. Their PMO team of six spent roughly half their time collecting data, building reports, and explaining variances. Project managers dreaded the weekly data calls. Executives had stopped reading the reports because they were 40 pages of noise.
The simplified model went in over about two months. First, all projects got categorized into risk tiers with appropriate error bands. Then a treemap visualization was built in their existing BI tool—nothing fancy, just color-coded rectangles that updated automatically from existing data sources.
The impact was immediate. Weekly data collection dropped from three days to a few hours. The executive report went from 40 pages to two—one treemap, one exception list. But the real win was catching a major integration project heading off the rails about three weeks earlier than they would have with the old system. The trend was visible in the treemap instead of buried in variance tables.
Their head of PMO made an observation that stuck with me: project managers started proactively updating their forecasts. When you're not asking for seventeen metrics, people are more willing to give you accurate data on the four that actually matter.
Common pitfalls when implementing scaled EVM
Even with a simplified model, organizations still mess this up in predictable ways.
Setting error bands too tight is the first mistake. If you're triggering escalations on 10% of your projects every week, your bands are too narrow. Start wide and tighten gradually as data quality improves.
Start wide and tighten gradually as data quality improves.
Treating all variances equally is the second. A marketing campaign running 20% over budget is completely different from an infrastructure deployment at the same variance. One might be testing and learning; the other might be a genuine structural problem. The model needs to reflect these differences or it just generates noise with better packaging.
The third mistake is subtler—forgetting about interaction effects. Projects share resources, dependencies, and budgets. A delay in one project might actually help another by freeing up capacity. Aggregation models need some way to account for these interactions, even if it's just a manual adjustment factor reviewed monthly.
The fourth is over-automating. AI-powered operational software can meaningfully improve data collection and aggregation, but someone still needs to apply judgment. A weird variance might be a data entry error, or it might be an early warning sign. Automation helps you see patterns faster—it doesn't replace thinking.
How modern operational platforms handle the data integration challenge
The hardest part of portfolio EVM isn't the math—it's getting clean, timely data from multiple systems. Most organizations have project data scattered across five or six tools, none of which connect properly.
This is where AI-enhanced platforms actually earn their keep. Instead of building complex point-to-point integrations, modern operational software can pull from multiple sources and reconcile differences automatically. When your infrastructure project reports costs in one system and your innovation pilot uses another, the platform normalizes the data and flags inconsistencies for human review.
Organizations that centralize this process typically cut EVM data collection time by 60–70%. The AI components help by learning patterns over time—if engineering projects consistently report costs two days late, the system adjusts aggregation timing automatically. If certain project managers consistently underestimate completions, it can surface that pattern and suggest an adjustment factor.
But the real value isn't the automation itself. It's what your PMO team does with the time they get back. When you're not spending three days building reports, you can spend that time actually working with project managers to understand what's happening on the ground—which is where every portfolio problem starts anyway.
Building your own scale-first EVM implementation
Start small. Pick five projects that represent different types in your portfolio. Implement the four-metric model for just those projects for one month. See what error bands make sense, what aggregation rules work for your organization's reality.
Build a simple treemap in whatever tool you have—Excel, Tableau, even PowerPoint works initially. The visualization matters less than the concept: size equals budget importance, color equals health, trends matter more than point-in-time variances.
Write down your decision triggers explicitly. What variances actually require action? What can wait until the next governance meeting? What's just noise? That exercise alone will probably eliminate half your current escalations before you change a single process.
Connect your EVM model to your existing portfolio KPI framework. Don't create another parallel reporting stream—your EVM metrics should feed into broader portfolio health monitoring, not duplicate it with slightly different numbers.
Then test the model against real decisions. When a project shows red in your treemap, does it actually need intervention? When the portfolio health score drops, is there really a problem? Adjust thresholds based on actual outcomes, not theoretical risks.
The brutal truth about portfolio EVM
Most PMOs implement EVM because they think they're supposed to. It's what mature organizations do. But maturity isn't about tracking everything—it's about tracking what matters and ignoring what doesn't.
A portfolio with perfect EVM data but slow decisions will fail. A portfolio with approximate data but fast, clear decisions will succeed. This model isn't theoretically optimal. It deliberately sacrifices precision for speed, completeness for clarity, comprehensiveness for actionability.
Stakeholders don't need to know that Project 17 has a 0.94 Schedule Performance Index. They need to know if the product launch is at risk. Your PMO team doesn't need to calculate cost variance for every work package. They need to know which projects require intervention this week.
That shift from precision to pragmatism is genuinely hard. It feels irresponsible at first, like you're not doing your job properly. But after a few months—when governance meetings actually drive decisions instead of drowning in data, when project managers trust the system instead of gaming it, when executives read your reports instead of ignoring them—it becomes obvious that less really is more.
Organizations that scale successfully don't do it by adding more metrics, more reports, more precision. They stay focused on what actually drives outcomes. In portfolio EVM, that means accepting some fuzziness in exchange for clarity, some error in exchange for speed, and some gaps in exchange for sanity.
Your EVM model should help you run your portfolio, not run your life. If you're spending more time feeding the model than using its outputs, something's broken. Fix it before it fixes you.
Ready to elevate your project delivery?
Join over 2,500 project teams using GoProjy to optimize resources, reduce risks, and drive portfolio success.