
Your project dashboard lights up red. Again. The construction project shows another task delay warning—the eighth one this week. Your team stops checking them because nine out of ten turn out to be nothing. Meanwhile, the procurement delays that actually derailed your last three projects? Those never triggered any warnings until it was too late to do anything about it.
This is what happens when early-warning triggers for schedule slippage get designed wrong. You end up with systems that cry wolf constantly while missing the signals that actually matter.
The broken promise of early-warning systems
Most PMOs set up early-warning triggers thinking they'll catch problems before they cascade. A task falls behind? Flag it. A milestone shifts? Alert everyone. Dependencies get tight? Sound the alarm.
What follows is noise. Constant, overwhelming noise that trains your team to ignore warnings altogether.
A manufacturing PMO I worked with had 47 active projects running simultaneously. Their early-warning system was generating around 280 alerts per week. Project managers spent Monday mornings wading through warnings trying to figure out which ones mattered. By Wednesday, new alerts had stacked up. By Friday, everyone had stopped trying.
When their flagship product launch slipped by three months, the post-mortem was painful. The critical supplier delay that caused it had actually triggered warnings six weeks earlier—buried in a flood of false positives about minor task delays that self-corrected within days.
Why traditional threshold triggers fail
Setting a simple threshold—task delayed by 2 days, flag it—seems logical. But real project work doesn't follow neat patterns. A developer might mark a task delayed on Monday because they're waiting on clarification, then catch up by Wednesday once they get an answer. A field crew might fall behind during bad weather, then make up time when conditions improve.
Stop losing track of critical projects.
GoProjy helps you monitor, prioritize, and deliver projects on time—seamlessly.
- Unified portfolio visibility
- Real-time resource tracking
- Milestone & risk alerts
No credit card required
These natural fluctuations create schedule noise—temporary variations that look like problems but aren't. When your early-warning system can't distinguish noise from genuine risk, alert fatigue sets in fast.
It gets worse when you factor in how different types of work behave. Critical path activities need different triggers than buffer tasks. A two-day delay in final testing matters way more than a two-day delay in documentation updates. Most systems treat them the same.
Then there's the aggregation problem. Five tasks delayed by one day each might mean nothing if they're unrelated. But if they all sit under the same vendor or the same workstream? That's a pattern worth looking at. Static thresholds can't catch that kind of systemic issue.
Building calibrated leading indicators that actually work
After watching dozens of PMOs wrestle with this, effective early-warning triggers need four components working together: task-level signals, rolling-window trend logic, smart aggregation rules, and triage thresholds. Miss any one of them and you're back to noise.
Task-level signals beyond simple delays
Start by categorizing tasks based on schedule sensitivity. Critical path tasks need hair-trigger warnings—even a one-day slip matters. Tasks with float can absorb more variance before you need to worry.
Critical path tasks: Zero tolerance for delays
-
Data migration windows
-
Production cutover activities
-
Regulatory submission deadlines
High-impact tasks: 1-2 day tolerance
-
Integration testing
-
User acceptance testing
-
Training delivery
Standard tasks: 3-5 day tolerance
-
Documentation updates
-
Non-critical bug fixes
-
Internal reviews
Buffer tasks: 7+ day tolerance
-
Nice-to-have features
-
Process optimization
-
Knowledge transfer sessions
Delays aren't your only signal, though. Task churn—when completion estimates keep shifting—often predicts future slippage better than current delays. A task that's been re-estimated three times in two weeks is a red flag, even if it's technically still on schedule.
Resource changes matter too. When a task gets reassigned multiple times, or the assigned person drops below 50% allocation, slippage usually follows. These leading indicators give you warning before the actual delay shows up in your schedule.
Rolling-window trend logic to filter noise
Single-point measurements create false positives. A task that's three days late today but was on track all last week? Probably noise. A task that's been trending later for two consecutive weeks? That's something real developing.
Implement rolling-window calculations that look at trends over time. Instead of "task is 3 days late," track "task has slipped an average of 1 day per week for the past 3 weeks." This smooths out temporary blips while surfacing persistent problems.
Here's a simple workflow for how rolling-window trend logic runs daily.
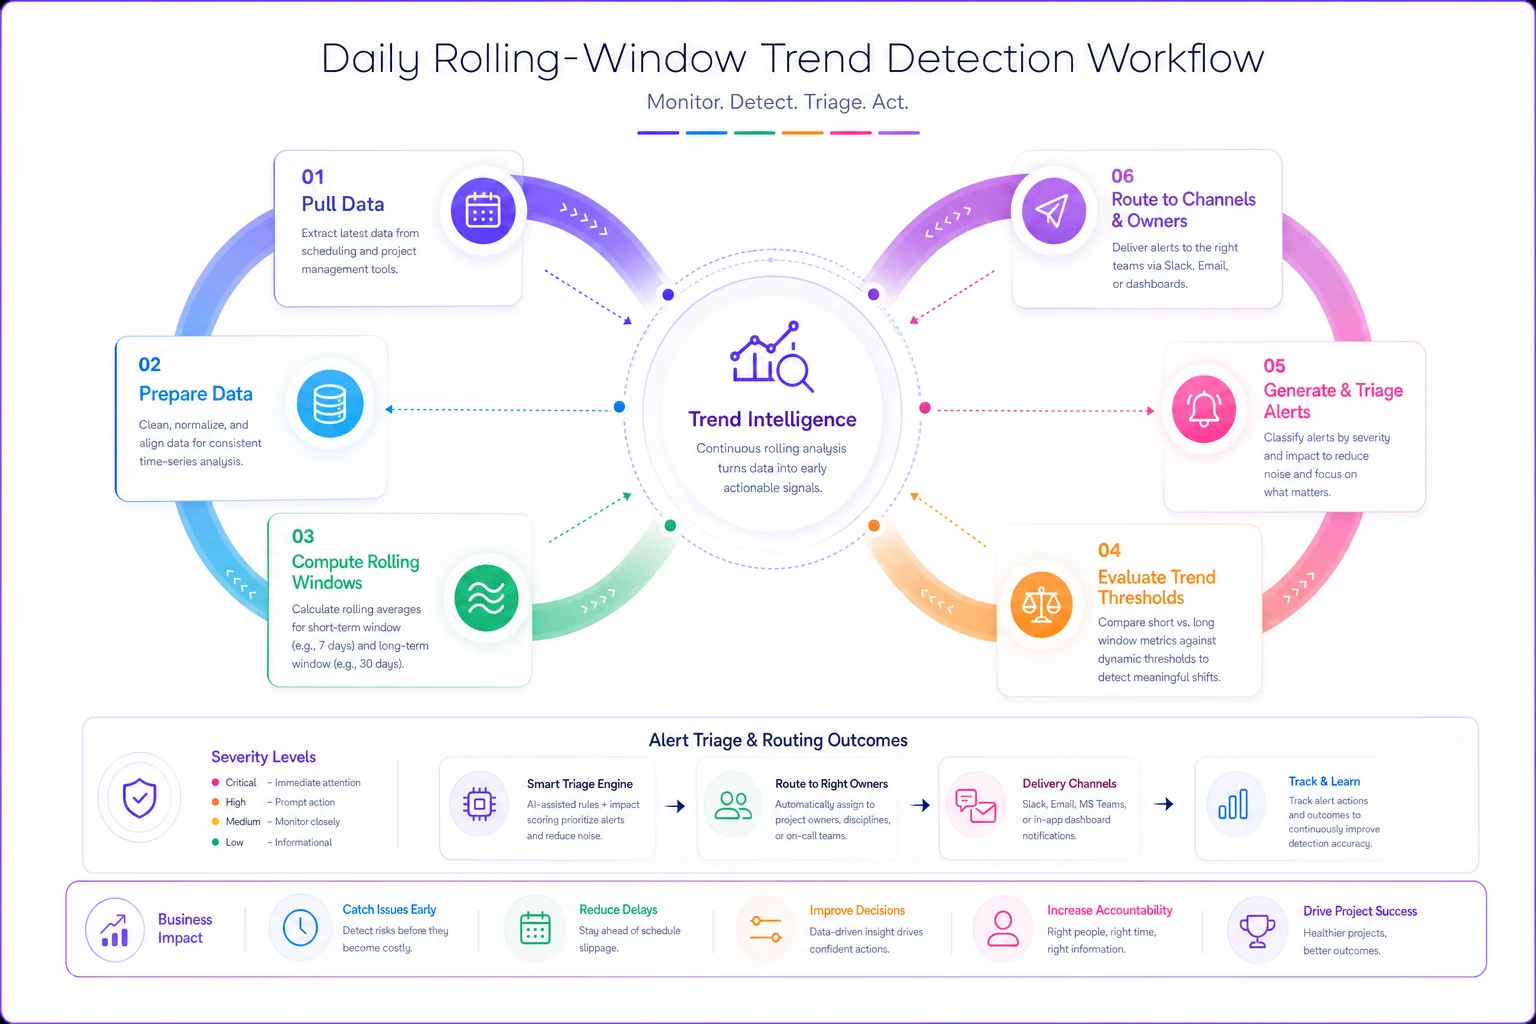
Instead of "task is 3 days late," track "task has slipped an average of 1 day per week for the past 3 weeks." This smooths out temporary blips while surfacing persistent problems.
Practically, calculate a 5-day rolling average for task completion rates. If the trend line shows consistent degradation—even small amounts—trigger a warning. A task might only be one day late today, but if it's been slipping half a day every update for two weeks, you're heading toward a five-day delay by next week.
For critical milestones, use a dual-window approach. Track both a short window (3-5 days) for rapid changes and a longer window (10-15 days) for gradual erosion. When both windows show negative trends, escalate immediately.
Aggregation rules that surface systemic issues
Individual task delays might be random. Patterns across multiple tasks reveal systemic problems. Aggregation rules need to look at three dimensions: organizational, temporal, and dependency-based.
Organizational aggregation: When multiple tasks under the same team, vendor, or project phase start slipping, you've got a resource or capability issue. Set triggers like "more than 30% of tasks assigned to Team X are behind schedule" or "vendor Y has missed 3 of their last 5 deliverables."
Temporal aggregation: Delays sometimes cluster around specific periods. Your European team might consistently fall behind during August. Construction projects often slip during rainy season. Build triggers that detect these patterns: "delays increased by 40% compared to the same period last month."
Dependency aggregation: This is where things get interesting. When multiple tasks feeding into the same milestone each slip slightly, the cumulative impact can be severe. Your system needs to track dependency chains and trigger warnings when aggregate slippage threatens downstream activities.
A pharmaceutical PMO built dependency aggregation that caught when three separate lab tests were each running just one day behind. Individually, no big deal. But all three fed into the same FDA submission deadline. The early warning gave them enough time to reallocate resources and avoid a costly regulatory delay.
Triage thresholds to cut false positives
Not every warning needs immediate action. Build a triage system that automatically categorizes alerts based on potential impact and required response time.
Critical (Red): Immediate escalation required
-
Critical path impact > 2 days
-
Budget impact > $50K
-
Milestone slip affecting external commitments
High (Orange): Review within 24 hours
-
Critical path impact 1-2 days
-
Multiple related tasks showing degradation
-
Resource conflicts affecting multiple projects
Medium (Yellow): Review within 72 hours
-
Non-critical path delays trending worse
-
Early indicators of resource issues
-
Vendor performance declining but within SLA
Low (Green): Monitor, no action needed
-
Buffer task delays within tolerance
-
Single-point delays with no trend
-
Issues with documented mitigation already in place
Make these thresholds dynamic based on project phase. During planning, you can tolerate more variance. During execution, tighten them. During critical phases like go-live, even small variations should escalate quickly.
Real-world implementation
A regional construction firm managing 22 concurrent projects overhauled their delivery performance after implementing this approach. Before, roughly 31% of projects finished late—usually by 3-4 weeks. Their early-warning system generated so many alerts that project managers had created email filters to automatically archive them.
We rebuilt their triggers using the four-component approach.
First, we classified tasks based on float analysis from their scheduling software. Critical path activities got zero-tolerance triggers. Tasks with 5+ days float got more relaxed thresholds.
Next, we implemented 7-day rolling trend calculations. Instead of flagging every weather delay, the system only triggered when weather impacts showed a worsening trend across the week.
For aggregation, we built rules around their known failure patterns. Multiple tasks under the same subcontractor slipping triggered a vendor performance review. Delays clustering around permit-dependent activities flagged potential regulatory bottlenecks.
Finally, we created a three-tier triage system. Red alerts went straight to the program director's dashboard and required same-day response. Yellow alerts aggregated into a weekly review. Green alerts just logged for trend analysis.
Results after six months:
| Metric | Before | After |
|---|---|---|
| Alerts per week | ~200 | ~25 |
| False positive rate | ~85% | <20% |
| On-time delivery | 69% | 78% |
| Avg slippage (late projects) | 3-4 weeks | 1-2 weeks |
More importantly, project managers started trusting the warnings again.
Common pitfalls when implementing
Over-calibrating to recent history: After a major project failure, teams often overcorrect by making triggers too sensitive. This creates noise all over again. Base calibration on patterns across multiple projects, not a single traumatic event.
Ignoring task interdependencies: A three-day delay on an independent task is very different from a three-day delay on something feeding five other workstreams. Make sure aggregation logic accounts for downstream impacts.
Static thresholds across the project lifecycle: Early phases have more uncertainty. Late phases need tighter control. Adjust triggers based on project maturity, not one-size-fits-all rules.
Alert bombardment: Even with good triggers, sending every alert to everyone creates fatigue. Route alerts based on role and impact. The PMO director doesn't need to know about every yellow warning.
No feedback loops: Triggers need tuning based on outcomes. Track which warnings led to useful interventions versus which were safely ignored. Use that data to refine your thresholds over time.
The math behind effective trend detection
You don't need complex statistics, but understanding the basics helps design better triggers.
Simple moving average (SMA): Smooth out daily noise by averaging values over a window. A 5-day SMA of completion rates helps identify trends without overreacting to single-day events.
Rate of change: Track not just delays but acceleration of delays. If a task slipped 1 day last week and 2 days this week, the increasing rate suggests bigger problems ahead.
Standard deviation bands: Set thresholds based on normal variance in your projects. If task durations typically vary by ±15%, don't trigger alerts until you exceed those bounds.
Weighted scoring: Not all signals carry equal weight. If resource changes predict delays 70% of the time but estimate changes only predict 30% of the time, weight accordingly.
A practical composite risk score formula:
Risk Score = (Delay Days × CP Weight) + (Trend Factor × Trend Weight) + (Resource Risk × Resource Weight)
-
CP Weight = 3 if on critical path, 1 if not
-
Trend Factor = average daily slip over past 5 days
-
Resource Risk = number of resource changes in past week
Trigger alerts when the Risk Score exceeds your threshold, which you tune based on project criticality.
Integration with existing systems
Your early-warning triggers are only useful if they connect to how teams actually work. That means integrating with your existing portfolio KPI systems and project management tools.
Most modern scheduling tools—MS Project, Primavera, Monday.com—can export task data. Build your trend calculations and aggregation rules in a middle layer that pulls this data, applies your logic, and pushes alerts to where people actually look: email, Slack, Teams, or dashboard widgets.
The integration typically works in this sequence:
-
Pull task status, dates, and assignments daily from your scheduling tool
-
Apply trend logic and aggregation rules through a calculation engine
-
Route warnings to appropriate channels based on triage level
-
Log which alerts led to action versus false positives for ongoing calibration
Push high-impact alerts to a team's preferred real-time channel (Slack/Teams) and low-impact ones to a digest to avoid noise at scale.
For organizations managing complex capacity and demand, connecting your early-warning system with resource management tools adds another layer of value. When triggers detect resource-related delays, you can check capacity models for reallocation options before the delay compounds.
Measuring effectiveness
Track these metrics to confirm your early-warning system is actually helping:
| Metric | What it tells you | Target |
|---|---|---|
| Signal-to-noise ratio | % of alerts that lead to useful action | 60%+ actionable |
| Lead time | How far ahead alerts fire before actual impact | Earlier = better calibration |
| Coverage | % of actual slips that had prior warnings | Missing real problems is worse than false positives |
| Response rate | Are teams actually reviewing and acting on alerts? | Low rates = fatigue or poor routing |
| Outcome improvement | Are projects finishing more on time? | Baseline against pre-implementation data |
A medical device company tracked these metrics quarterly. Their initial triggers had only 35% actionable alerts but caught 78% of eventual delays. After three rounds of calibration, they reached 65% actionable alerts while holding 75% coverage—a much better balance.
When early-warning systems make sense (and when they don't)
This level of sophistication pays off when you're managing 10 or more concurrent projects, when schedule delays trigger significant costs or penalties, when teams are distributed across locations or time zones, or when historical on-time delivery is sitting below 70%.
It's probably overkill if you're running fewer than 5 simple projects with predictable, repetitive work, a co-located team with solid communication, and no real penalty for schedule flexibility.
For smaller operations, start simple. Even just implementing rolling-average trend detection can dramatically cut false positives compared to static thresholds.
The path forward
Building effective early-warning triggers isn't about having more alerts—it's about having the right alerts at the right time. Calibrated task-level signals, trend-based logic, intelligent aggregation, and practical triage thresholds together turn noise into something your team can actually use.
Start with your biggest pain point. If false positives are killing credibility, implement rolling-window trends first. If you're missing systemic issues, focus on aggregation rules. Build incrementally and tune based on what you see.
The goal isn't perfection. It's creating a system that surfaces real risks early enough to act on, while keeping signal quality high enough that your team pays attention. Get that balance right and you'll catch problems weeks before they derail projects—without drowning in alerts that don't matter.
For teams ready to scale this further, AI-powered operational platforms can automate much of this logic—learning your organization's patterns, tuning thresholds over time, and surfacing intervention options based on what worked in similar situations. But whether you build it yourself or use specialized software, the principles stay the same: filter the noise, surface the patterns, and give your team warnings they can actually trust and act on.
Building effective early-warning triggers isn't about having more alerts—it's about having the right alerts at the right time. Calibrated task-level signals, trend-based logic, intelligent aggregation, and practical triage thresholds together turn noise into something your team can actually use.
Start with your biggest pain point. If false positives are killing credibility, implement rolling-window trends first. If you're missing systemic issues, focus on aggregation rules. Build incrementally and tune based on what you see.
Ready to elevate your project delivery?
Join over 2,500 project teams using GoProjy to optimize resources, reduce risks, and drive portfolio success.