

Most portfolio dashboards break in the same quiet way. The numbers look fine on Monday, someone challenges a figure on Thursday, and by the time you trace it back you find a connector that stopped syncing eleven days ago, a project ID that got renamed in the source system, and a "% complete" field that means three different things depending on which PM filled it in.
The reporting layer almost never gets blamed. People blame the PM, the tool, the "data quality." But the real failure sits between systems — in how you pull data from Jira, your ERP, timesheets, and finance, and how you reconcile it into something a portfolio KPI can actually stand on. Getting the portfolio data integration patterns right is what separates a PMO that spends half its meeting arguing about whose number is correct from one that actually makes decisions.
This is a systems article, not a list of connectors to buy. The goal is to show how the moving parts fit together — connector types, a shared model everything maps into, and the operational contracts that keep it honest when a source goes stale.
Why integration is the actual bottleneck (not reporting)
When KPIs feel unreliable, the instinct is to rebuild the dashboard. Better visuals, tighter definitions, a governance doc. That helps at the margins, but it treats a plumbing problem as a presentation problem.
Underneath, a mid-sized portfolio typically pulls from five to eight systems: a work tracker (Jira, ADO, Asana), an ERP or finance system for actuals, a timesheet tool for effort, a resource or HR system for capacity, and usually a couple of spreadsheets that never quite died. Each has its own refresh rhythm, its own idea of what a "project" is, and its own failure modes. The dashboard sits at the very end of that chain, inheriting every problem upstream with no way to signal which number is fresh and which is stale.
-
Identity — the same project has different keys in each system, so joins silently drop or double-count.
-
Timing — finance closes monthly, work trackers update in real time, timesheets lag a week. Roll them up on the same screen and you're mixing three clocks.
-
Meaning — "complete," "actuals," "committed," "forecast" each carry different definitions per source, and nobody agreed on the canonical one.
If you've already built a solid definition layer — which we walked through in building a portfolio KPI data model and governance system — the integration layer is what feeds it. A perfect KPI definition on top of an unreliable feed still produces an unreliable number.
Map connector types to what each KPI actually needs
Not every connection needs to be real-time, and not every KPI tolerates lag. The mistake is treating all integrations the same — either everything is a nightly batch (so your risk signals are always a day old) or everything gets pushed to real-time (so you burn engineering effort keeping finance data current that only changes monthly anyway).
Stop losing track of critical projects.
GoProjy helps you monitor, prioritize, and deliver projects on time—seamlessly.
- Unified portfolio visibility
- Real-time resource tracking
- Milestone & risk alerts
No credit card required
The useful move is matching the connector type to how much staleness a KPI can actually tolerate. A schedule-slippage trigger needs fresh work-tracker data. A cost-to-complete roll-up is fine on a weekly or monthly cadence because finance itself only moves that fast.
| Connector type | Typical source | Refresh pattern | KPIs it should feed | Staleness tolerance |
|---|---|---|---|---|
| Event/webhook (push) | Work tracker status changes | Near real-time | Schedule slippage triggers, blocked-item counts, WIP | Minutes to hours |
| Incremental API pull | Timesheets, resource system | Daily | Capacity utilization, effort burn, allocation conflicts | 1–2 days |
| Batch/file export | ERP, finance actuals | Weekly or at month close | Cost-to-complete, budget variance, EVM roll-ups | Aligned to finance close |
| Manual/attested upload | Risk registers, contract milestones | Weekly, attested | Risk scores, vendor milestone status | Depends on attestation cadence |
| Reference/master sync | Project master, org hierarchy | On change | Everything (identity backbone) | Must be current |
The reference/master sync row is the one teams skip most often, and it's the one that breaks everything else. If your project master isn't the single source of identity that all other connectors resolve against, joins will drift the moment someone renames a project or spins one up in Jira before it exists in the portfolio system.
Prioritize reference/master sync as the identity backbone so other connectors always resolve to a canonical project ID.
A pattern worth borrowing: don't let operational systems create portfolio-level identity. New projects get their canonical ID minted in the portfolio layer first, then flow down into work trackers and finance. It feels bureaucratic until the first time it saves you from a phantom project inflating your active count.
A compact canonical model you can actually maintain
The temptation with a canonical model is to model everything. Every field, every status, every custom attribute someone once asked for in a steering meeting. That model becomes unmaintainable within two quarters and people quietly go back to spreadsheets.
Project — the identity backbone.
-
project_id(canonical, minted in portfolio layer) -
name,status,stage/gate -
owner,portfolio/program -
start,plannedend,forecastend -
source keys
jirakey,erpcode, etc. (the crosswalk lives here)
Resource — capacity and effort.
-
resource_id,role/skill -
capacity(per period) -
allocation(to project, per period) -
actual_effort(from timesheets, per period)
Finance — the money view.
-
project_id(foreign key) -
budget,committed,actuals,forecast -
period(the crucial field — every finance record is period-stamped) -
capex/opexclassification
The relationships are simple: a Project has many Resource allocations and many Finance records per period. Everything else — utilization, variance, burn rate, slippage — is derived from those three.
The most important design choice here is that every metric is period-stamped and source-tagged. When someone challenges a number in a review, you can answer immediately: this figure is from the finance batch dated the 3rd, this one is from the work tracker as of 9am today. You're not guessing which clock produced which number. This same discipline underpins finance-ready roll-ups, which we covered in making portfolio forecasts finance-ready with data contracts.
One thing that comes up repeatedly in real implementations: the crosswalk — the mapping of canonical IDs to source keys — needs an owner and a review cadence, or it rots. Source systems change keys, projects merge, teams reorganize. A stale crosswalk is invisible until your active-project count is off by six and nobody can explain why.
Sync SLAs: making freshness a contract, not a hope
Most portfolios have nothing here at all. They have connectors. They don't have agreements about how fresh each feed must be, what happens when it isn't, and who gets told.
An SLA per connector is a short, boring, incredibly useful document. For each feed you define:
-
Freshness target — max acceptable age of the data (e.g., work tracker ≤ 2 hours, finance ≤ 1 business day after close).
-
Check frequency — how often you verify the feed actually ran.
-
Staleness threshold — the age at which the data is no longer trusted for decisions.
-
Owner — the human accountable when it breaks.
-
Fallback behavior — what the KPI does when data is past threshold.
That last point is what protects your credibility. A KPI that silently keeps showing an old number is worse than one that admits it's stale. The dashboard should visibly degrade: gray out the tile, flag it with a "last good sync" timestamp, or fall back to the last attested value with a clear marker.
A workflow for handling a stale feed
Walk through what should happen when the ERP batch fails on a Monday: The scheduled check at 8am detects the finance feed hasn't updated since Friday. It's past the one-business-day threshold. The system marks all finance-derived tiles — variance, cost-to-complete — as stale, showing the last good value dated Friday with a visible "stale since" flag. The finance connector owner gets a notification. Until it's resolved, any portfolio review pulling those numbers sees the flag and knows not to make an irreversible funding call on stale actuals. When the batch recovers, the flag clears automatically and the timestamp updates.
Visualizing this flow helps teams standardize responses.
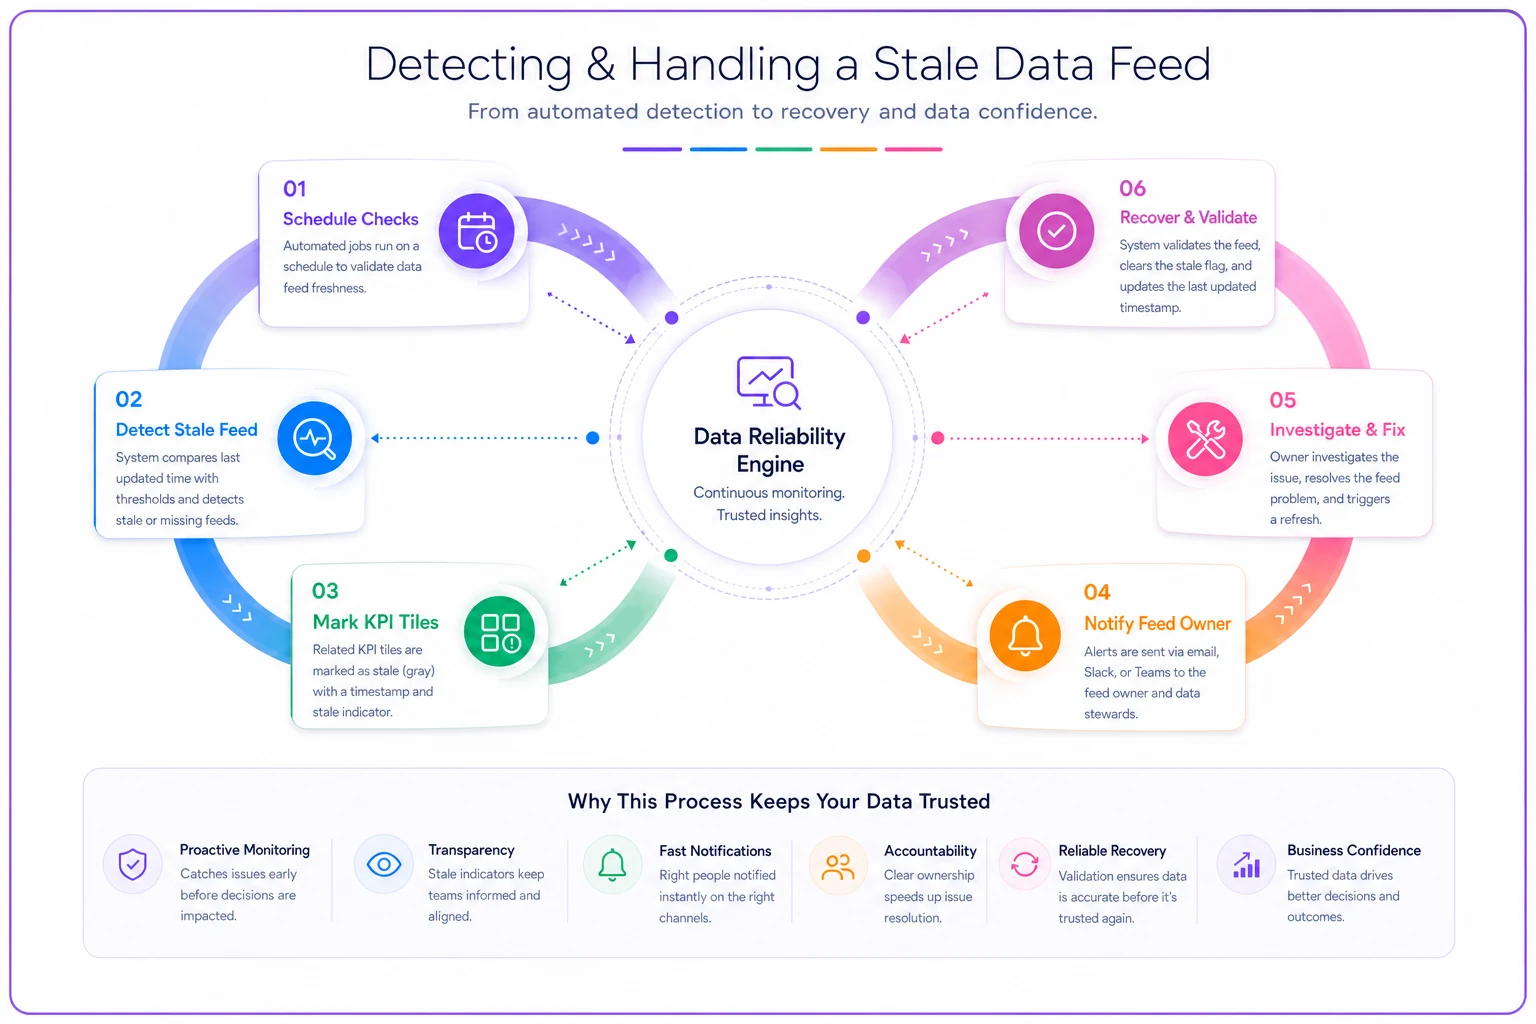
The point isn't the alerting. It's that a stale number never masquerades as a fresh one. That single behavior eliminates the most common credibility failure in portfolio reporting.
Fallback contracts: what a KPI does when the truth is missing
Freshness SLAs tell you when data is stale. Fallback contracts tell you what to show in the meantime. These two get conflated but they're different decisions.
For each KPI, decide the fallback explicitly:
-
Hold last good value — appropriate for slow-moving finance metrics. Show Friday's actuals, clearly marked, until the feed recovers.
-
Suppress/gray out — appropriate for real-time risk signals where a stale value is actively misleading. Better to show nothing than a two-day-old "no blockers" status.
-
Fall back to attested — appropriate where a human can vouch for a manual figure when the automated feed is down.
-
Widen the error band — for estimate-based KPIs, stale inputs mean the number is less certain, so present it as a range rather than a point.
A connector decision table makes this operational and audit-friendly:
| Feed state | Age vs threshold | KPI display | Who's notified | Decision allowed? |
|---|---|---|---|---|
| Fresh | Within target | Live value | — | Yes |
| Lagging | Past target, under threshold | Live value + "aging" flag | Feed owner | Yes, with caution |
| Stale | Past threshold | Last good value, marked stale | Feed owner + PMO lead | No irreversible calls |
| Failed | No data | Suppressed / grayed | Feed owner + PMO lead | No |
The reason this is worth the effort: audit. When someone asks six months later "what did we know when we reapproved that project," you can reconstruct exactly what the dashboard showed and how fresh each input was. That's the difference between a defensible decision trail and a shrug.
A short real scenario
A professional services firm running around 40 concurrent client projects had a recurring problem: their utilization and margin numbers never matched what finance reported at month end. The gap was usually 8–12%, sometimes worse, and every steering meeting burned 20 minutes arguing about whose figure was real.
The root cause wasn't the KPI math. It was three seams doing exactly what we described above. Project IDs in the timesheet tool didn't cleanly map to finance cost codes, so effort was being attributed to the wrong projects. Timesheets lagged the work tracker by about a week, making utilization look artificially low mid-month. And "actuals" in the dashboard were pulling a real-time approximation while finance used the closed monthly figure.
They didn't buy anything new. They introduced a canonical project master with an owned crosswalk, period-stamped every finance and effort record, and set two simple sync SLAs — timesheets daily with an "aging past 2 days" flag, finance aligned to close with a stale marker. The month-end reconciliation gap dropped to low single digits. More importantly, when a number was off, they could see instantly which feed was stale instead of relitigating the whole model.
The qualitative shift mattered more than the percentage drop. Steering meetings stopped being about data trust and went back to being about decisions.
When this level of rigor makes sense — and when it doesn't
When it's worth it: You're past roughly 20–30 concurrent projects, pulling from four or more systems, and you've had at least one review where a wrong number caused a wrong call. Below that scale, a well-maintained spreadsheet with disciplined refresh habits can genuinely work. Building connector SLAs at that point is over-engineering.
When it's a bad idea: If your project definitions and KPI meanings aren't settled yet, don't build integration on top of shifting sand. Nail the canonical definitions first. Integrating five systems into a model nobody agrees on just industrializes the confusion.
Who should not do this: A small PMO with two people and a stable, slow-moving portfolio. The maintenance cost of connector SLAs and crosswalk reviews will exceed the value. Match the machinery to the scale.
Where this fits as you grow
The pattern scales predictably. Early on, identity and meaning are the problems — a handful of projects, but nobody agrees what "done" means or which system owns the project list. As the portfolio grows, timing becomes the dominant issue: more systems, more clocks, more chances for one stale feed to poison a roll-up. At full portfolio scale, the failure mode shifts again to silent staleness — feeds that break without anyone noticing until a decision is already made on old data.
Good integration patterns anticipate all three. A canonical model fixes identity and meaning. Sync SLAs fix timing. Fallback contracts fix silent staleness. You don't build them all at once — you build them in that order, as each problem starts to actually hurt.
The reliable-KPI PMO isn't the one with the prettiest dashboard. It's the one that can answer three questions on the spot: where did this number come from, how fresh is it, and what happens if it's wrong. Get the integration layer right and those answers stop being a scramble. They become the boring, dependable foundation everything else stands on.
Ready to elevate your project delivery?
Join over 2,500 project teams using GoProjy to optimize resources, reduce risks, and drive portfolio success.