



Three months into running portfolio financial forecasting for a 42-project hardware division, something weird surfaced. Finance kept rejecting our forecasts — not because the numbers were wrong, but because they arrived at the wrong point in their close cycle. We'd submit cost-to-complete projections on the 15th, only to find out finance needed them by the 12th for accrual calculations. Meanwhile, project managers were updating forecasts whenever it suited them, which meant our roll-ups included data anywhere from 2 days to 3 weeks old.
The meeting cadence that finally gets finance what they need from project portfolios
The real problem wasn't accuracy. It was timing and consistency. Finance operates on strict cadences — month-end close, quarterly forecasts, annual budgets. Most PMOs run on project rhythms — sprint reviews, milestone gates, steering committees. These two worlds rarely sync naturally, which creates a mess of reconciliation issues, stale data, and frustrated finance partners who can't trust the numbers.
What actually works: explicit data contracts between PMO and finance, rigid meeting cadences aligned with finance cycles, and roll-up logic that handles the messiness of multi-speed projects. This isn't about prettier reports. It's about building a forecasting system finance can actually use for accrual calculations, actuals-vs-forecast variance analysis, and cash flow planning.
Why portfolio forecasts fail finance teams
Most PMOs think they're doing finance a favor by sending detailed project financials every month. Walk into any FP&A team and you'll hear a different story. They're drowning in project data that doesn't match their chart of accounts, arrives too late for their close process, and uses different cost categories than their ERP system.
Stop losing track of critical projects.
GoProjy helps you monitor, prioritize, and deliver projects on time—seamlessly.
- Unified portfolio visibility
- Real-time resource tracking
- Milestone & risk alerts
No credit card required
The disconnect happens at multiple levels. Project managers think in terms of story points, sprints, and deliverables. Finance thinks in capital vs. operating expense, accruals vs. cash basis, and period-over-period variance. Translating between these worlds without clear rules creates chaos.
A few things that typically break:
Your infrastructure project shows $2M in "development costs" but finance needs to know how much is capitalizable vs. expense. Your forecast shows costs by quarter, but finance needs monthly accruals. Your cost-to-complete assumes linear burn, but contractor invoices hit in lumps. Different projects use different cost categories — one calls it "external resources," another "professional services," a third "consulting fees." Finance manually maps everything to GL codes every single month.
The timing problem compounds all of this. Finance typically starts month-end close around day 3 of the following month. They need preliminary numbers by day 2, final by day 5, variance explanations by day 7. But project managers are still updating last month's actuals on day 10 because they're waiting on vendor invoices. By the time you roll up accurate project financials, finance has already closed the books with estimates.
Scale makes it worse. With 10 projects, manual coordination is manageable. With 50+ projects across different business units, it's not.
The data contract that prevents forecast rejection
A data contract between PMO and finance isn't some formal document nobody reads. It's an operational agreement about exactly what data flows when, in what format, with what validation rules. Think of it as the API spec between two departments.
The contract needs five core components.
Timing agreements. Finance provides a calendar showing close dates, forecast submission deadlines, and blackout periods. PMO commits to specific delivery dates that give finance at least 48 hours before their deadlines. For monthly updates, this usually means PMO data locks on the last business day of the month, with roll-ups delivered by noon on day 1 of the following month.
Cost categorization mapping. Every project cost category maps to exactly one GL account. No ambiguity. "Cloud infrastructure" maps to account 64250. "External developers" map to account 71100. A master mapping table both teams can reference. When projects need new categories, there's a process to add them with finance approval.
Granularity rules. Finance needs different granularity for different purposes. Month-end close needs actuals plus current month forecast. Quarterly forecasts need monthly breakdowns for the next 12 months. Annual planning needs quarterly projections for 3 years. The contract specifies exactly what level of detail gets provided when.
Validation thresholds. Not every variance needs an explanation. The contract defines materiality thresholds — typically 10% or $50K, whichever is greater. Below that, normal variance is expected. Above it, the project provides a written explanation. This prevents finance from chasing tiny variances while ensuring big surprises get documented.
Change protocols. When forecasts change materially between cycles, there's a notification process. If a project's cost-to-complete jumps by more than $100K, finance gets notified immediately — not at the next monthly cycle. This stops surprise budget overruns from hiding until quarter-end.
Lock PMO data at least 48 hours before finance deadlines to avoid late rejections and last-minute adjustments.
In practice: on day -2, project managers submit updated forecasts into the portfolio system. System locks at 5 PM. Day -1 is PMO review and roll-up. Day 1, finance receives the consolidated forecast with variance explanations for anything over threshold. Day 3 is a 30-minute sync to review major variances. Day 5, follow-up items get resolved before finance closes their forecast.
Meeting cadence that syncs PMO and finance cycles
The meeting rhythm between PMO and finance needs to serve three purposes: regular data handoffs, variance reviews, and forward-looking alignment. Most organizations try to do all three in one massive monthly meeting nobody wants to attend. That doesn't work.
You need three distinct meeting types.
Weekly flash updates (15 minutes). Every Wednesday, PMO sends finance a one-page flash report showing any material changes to the portfolio forecast. No meeting unless finance has questions. The flash covers five things: projects over budget, projects under budget, new projects added, projects completed, major risks that could impact forecast.
Monthly variance review (45 minutes). Day 3 of each month, after finance has received the formal forecast submission. Fixed agenda: review variances over threshold, discuss forecast changes for next month, identify data quality issues. Attendance is limited to PMO lead, finance analyst, and program controllers for projects with major variances. No status updates, no project details — just financial variance discussion.
Quarterly deep dive (2 hours). Aligned with quarterly business reviews, usually the third week after quarter close. This is where you review portfolio-level trends, discuss resource allocation, and align on forecast methodology changes. Broader attendance here — CFO or finance director, PMO director, major program leads.
Protecting these meetings from scope creep matters more than people expect. The weekly flash doesn't become a status meeting. The monthly variance review doesn't become a project review. The quarterly deep dive doesn't become a budget negotiation. Each meeting has a specific financial purpose.
Between formal touchpoints, there needs to be a clean escalation path. If a project manager discovers a $500K budget issue on a Tuesday, they don't wait until Wednesday's flash. Direct escalation to both PMO and finance leadership within 4 hours. Finance has the same escalation rights going the other direction.
Cost-to-complete roll-up logic that handles real portfolio complexity
Rolling up cost-to-complete across a portfolio sounds simple until you try it. Project A uses bottom-up task estimates. Project B uses parametric modeling based on story points. Project C is 90% complete but has been "almost done" for three months. Project D just found out their vendor underestimated by 40%. How do you combine these into a portfolio forecast finance can trust?
The answer isn't sophisticated math. It's consistent business rules that handle the messiness of real projects.
Use confidence bands, not point estimates. Every project provides three numbers: optimistic (P20), most likely (P50), and pessimistic (P80). For portfolio roll-up, don't just add the most likely values. Use a weighted approach based on project maturity — early-stage projects weighted toward P80, late-stage toward P50. This builds conservatism into the portfolio forecast without requiring manual adjustments every cycle.
Apply completion factors based on history. Track your organization's actual history of how much projects overrun in their final 20%. Across different portfolios, it tends to land somewhere between 5% and 15%. If a project claims they're 80% complete with $1M spent and $250K remaining, but the historical factor is 1.12, you forecast $280K remaining. This is what prevents the eternal "90% complete" problem.
Segregate commitment types. Signed contracts are nearly certain. Approved purchase orders are highly likely. Resource forecasts are estimates. Contingency is a guess. The roll-up logic should treat each differently: committed costs at 100%, approved but uncommitted at 95%, forecast resources at 85%, contingency at 50%. Finance gets a realistic view of what's truly locked versus what might shift.
Handle time-phasing mechanically. Projects are bad at forecasting when costs will actually hit. They default to even spreads, but costs come in lumps. Use standard distribution curves based on project type instead. Software projects typically follow something like a 20-50-30 curve across their remaining period. Infrastructure projects tend to be back-loaded — more like 10-30-60. Apply these mechanically rather than trusting project-level phasing.
Include below-the-line adjustments. The raw roll-up is just the starting point. Portfolio-level contingency, forex adjustment for international vendors, inflation on multi-year projects, productivity assumptions for resource-based work — these need to be visible and consistent, not buried in individual project forecasts.
Here's a simple workflow for the roll-up process.
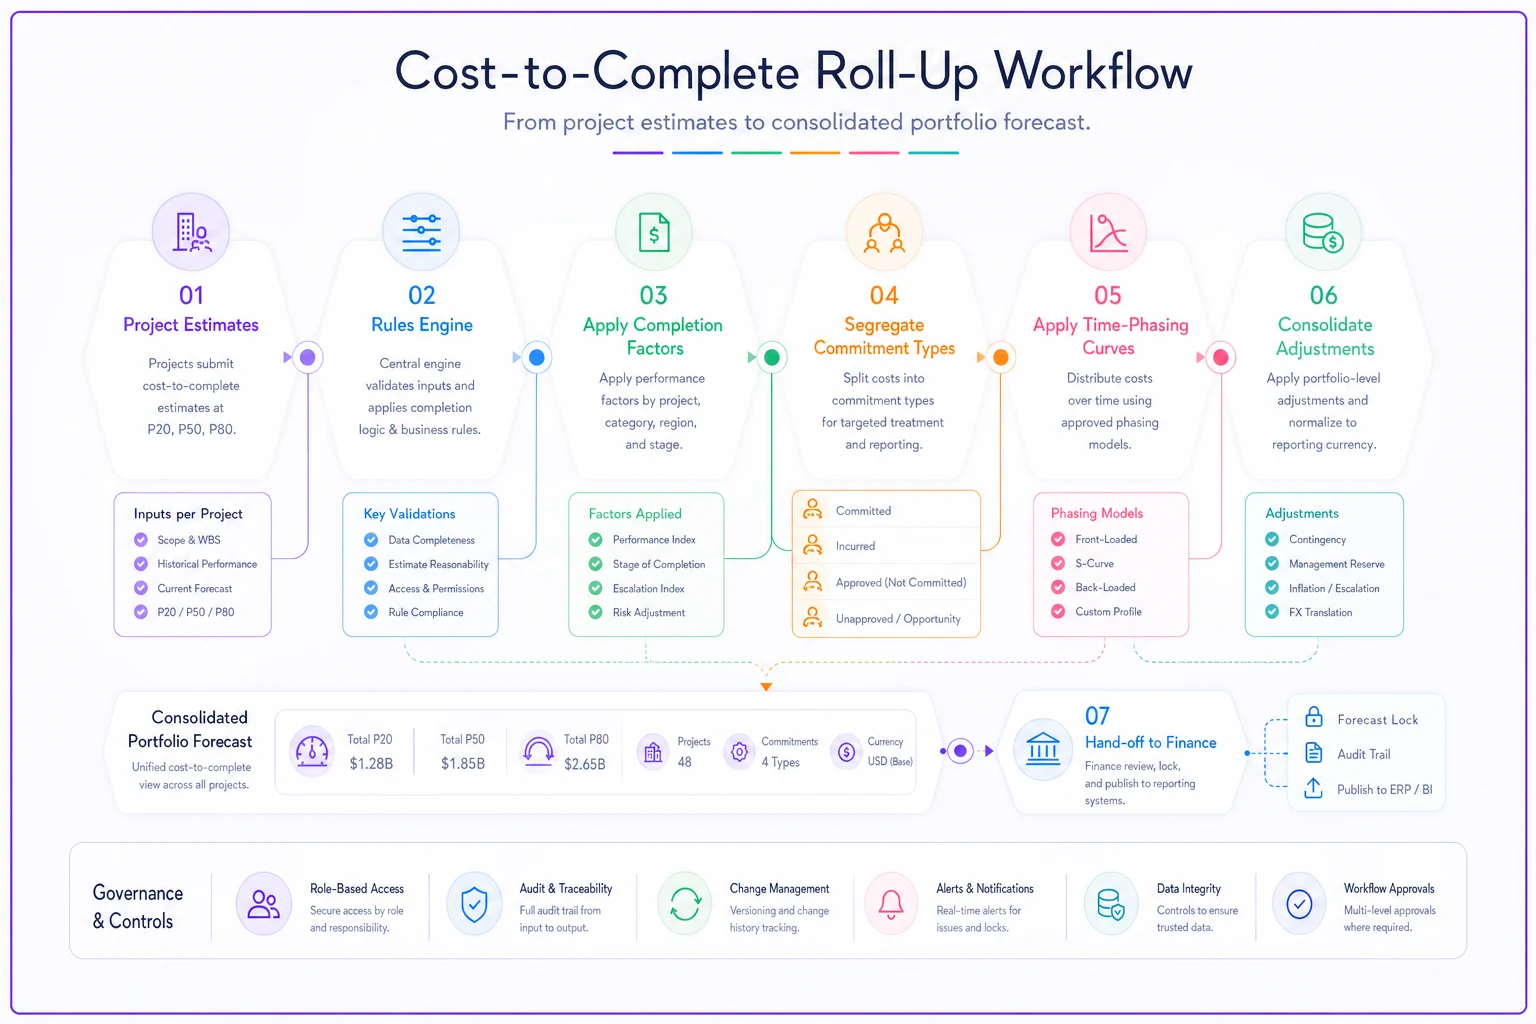
The diagram shows how project estimates flow through business rules into a consolidated portfolio forecast that finance can consume.
A worked multi-project example with reconciliation
Here's a portfolio forecast walkthrough with three projects to show how this plays out. Based on a product development portfolio, with numbers adjusted for confidentiality.
Starting position (January 1):
-
Project Atlas
Mobile app redesign - Budget: $2.4M - Spent to date: $800K - Original completion: June 30 - Team: 8 internal developers, 2 UX contractors
-
Project Titan
Backend platform upgrade - Budget: $3.8M - Spent to date: $2.1M - Original completion: May 31 - Team: 12 internal developers, 4 vendor resources
-
Project Mercury
Analytics dashboard - Budget: $900K - Spent to date: $150K - Original completion: August 31 - Team: 4 internal developers, 1 data contractor
January month-end forecast process:
On January 29 (day -2), each PM submits their cost-to-complete:
Atlas PM: $1.5M remaining, linear burn through June
Titan PM: $1.6M remaining, front-loaded through May
Mercury PM: $700K remaining, back-loaded through August
The system doesn't just accept these numbers. Standard adjustments get applied:
Atlas gets a 1.08 completion factor (mobile projects typically overrun by around 8%), bringing remaining to $1.62M. The linear burn gets replaced with a standard software curve: Feb $324K, Mar $405K, Apr $405K, May $324K, Jun $162K.
Titan is already 55% spent but only 35% complete based on milestone mapping. Red flag. The system automatically applies a 1.15 completion factor for troubled projects, bringing remaining to $1.84M. Timeline gets extended by one month based on historical patterns for projects this far behind schedule.
Mercury is early stage — only 17% spent — so it gets weighted toward the P80 estimate. The PM's $700K was P50. Their P80 was $850K. The portfolio roll-up uses $800K.
Roll-up with adjustments:
| Project | PM Estimate | Adjusted CTC | Confidence | Notes |
|---|---|---|---|---|
| Atlas | $1,500K | $1,620K | 75% | Completion factor 1.08 |
| Titan | $1,600K | $1,840K | 60% | Troubled project factor 1.15 |
| Mercury | $700K | $800K | 65% | Early stage, using P80 |
| Portfolio Subtotal | $3,800K | $4,260K | - | - |
| Portfolio contingency (7%) | - | $298K | - | Standard portfolio buffer |
| Forex adjustment | - | $45K | - | Titan vendor paid in EUR |
| Portfolio Total | $3,800K | $4,603K | 68% | Weighted average confidence |
The gap between the PM estimates and adjusted totals — $803K — is the system doing its job. Finance knows that's the range they're working with, not a number someone made up in a spreadsheet.
February actuals reconciliation:
-
Atlas
Spent $287K (forecast was $324K)
-
Titan
Spent $425K (forecast was $380K)
-
Mercury
Spent $95K (forecast was $80K)
Total actual: $807K Total forecast: $784K Variance: $23K over (2.9%)
Under the 10% threshold, so no detailed variance explanation required. But the patterns are worth noting: Titan continues burning hot, Atlas is under-burning which might indicate schedule slip, Mercury is ramping as expected.
Forecast revision for March:
Based on February actuals, the go-forward forecast gets revised:
Atlas reduces remaining to $1,333K (better contractor rates negotiated) Titan increases to $1,990K (vendor submitted a $150K change order) Mercury holds at $705K
Portfolio total moves to $4,751K — a $148K increase month-over-month. This triggers the change protocol. Finance gets immediate notification with an explanation, not a surprise at the next cycle.
When to trigger finance reconciliation outside normal cadence
Monthly cadence handles normal operations, but you need clear triggers for breaking the cycle and reconciling immediately. These aren't judgment calls — they're mechanical rules.
Threshold triggers:
-
Any single project variance exceeds $250K or 15% of remaining budget
-
Portfolio-level variance exceeds $500K or 5% of remaining portfolio
-
A project's monthly burn rate changes by more than 40%
-
New unplanned work exceeds $100K
Event triggers:
-
Contract termination or vendor failure
-
Project cancellation or indefinite hold
-
Scope change requiring a change order
-
Discovery of accounting error in previous periods
-
Resource reallocation affecting more than 3 people
When a trigger hits: 4 hours to notify finance, 24 hours to provide preliminary impact assessment, 72 hours to submit revised forecasts. This prevents finance from getting blindsided at quarter-end, which is really the whole point.
The reconciliation itself follows a standard format: what changed, why it changed, impact on current month, impact on the full project, impact on portfolio, and any offsetting actions. Finance needs this structure to update their accruals and explain variances to executive leadership. Anything less and you're back to ad hoc emails that nobody can trace six months later.
Building this system with operational software
Without software, you're manually collecting forecasts, applying adjustments in spreadsheets, and hoping nothing breaks between systems. With the right platform, most of this becomes automatic.
The key is choosing software that understands both project execution and financial reporting. Too many PMO tools focus on Gantt charts and resource leveling but can't produce a proper financial forecast. Too many financial tools can roll up costs but don't understand project dynamics.
What you actually need is operational software that bridges both worlds — something that pulls project data from your execution tools (Jira, Monday, Smartsheet), applies your business rules for cost-to-complete calculations, and generates finance-ready reports on your defined cadence. The platform handles timing locks, variance calculations, and threshold monitoring automatically.
AI automation helps reduce the manual reconciliation work that burns hours every month. Instead of PMs manually updating forecasts, the platform can analyze project velocity, burn rates, and historical patterns to surface suggested updates. Instead of finance manually mapping cost categories, the system learns from previous mappings and applies them going forward. The mechanical work gets handled, which means people can actually focus on understanding why variances exist and what to do about them — instead of just chasing them.
Any platform you use also needs to maintain the audit trail finance requires. Every forecast change, adjustment, and override tracked with who, what, when, and why. When auditors ask why the Q2 forecast changed three times, you need clean documentation to point to. Not a conversation where everyone tries to remember what happened.
The results when PMO and finance finally sync
When this system works, the change is noticeable pretty quickly. Finance stops rejecting forecasts. Project managers stop fielding random requests from FP&A. Month-end close becomes routine instead of a fire drill.
One organization went from spending roughly 3 days per month on forecast reconciliation down to about 4 hours. Forecast accuracy improved from around ±20% to ±8%. More importantly, finance started trusting PMO numbers enough to use them directly in board reports — instead of building their own shadow forecasts on the side, which had been the norm for years.
The real value comes from what this enables downstream. When finance trusts your forecasts, they're more willing to approve funding for new work. When forecasts are accurate, you can run closer to full capacity without risking overruns. When the monthly process is smooth, you can focus on strategic portfolio allocation decisions instead of just explaining variances after the fact.
The system also surfaces problems earlier. That Titan project in the example above — with monthly variance review and clear triggers, finance sees the trouble pattern two months before it becomes a crisis. They can work with PMO on options: reduce scope, add contingency, delay other projects. Instead of discovering a $500K overrun at quarter-end with no good options left.
Common pitfalls and how to avoid them
Even with good intentions, organizations mess this up in predictable ways.
Over-automating too early. Don't try to automate everything before you have stable processes. Run manually for 2-3 months, document what actually works, then automate. Otherwise you're just automating chaos faster.
Ignoring the culture change. Project managers who've never had to care about financial accuracy suddenly need to provide reliable forecasts. This requires training, clear expectations, and often changes to how performance is evaluated. Assuming people will naturally adapt is a mistake.
Making finance the enemy. PMO and finance should be partners. When finance pushes back on forecasts, there's usually a reason — they're getting pressure from above about accuracy. Work together to solve the root cause instead of fighting over who's right.
Forgetting audit requirements. Whatever system you build needs to satisfy your auditors. That means documentation, approvals, and change tracking. Build it in from the start rather than scrambling during audit season.
Creating too many exceptions. Every project thinks it's special. Resist this. The power of the system comes from consistency. Allow exceptions only for genuinely different project types — capital vs. operating — not because someone dislikes the standard rules.
Even with good processes, rolling up portfolio financial forecasting isn't just about getting numbers to finance on time. It's about building a systematic bridge between how projects actually operate and how finance needs to report. When the cadence, data contracts, and roll-up logic are right, both teams can focus on their actual work instead of fighting over forecasts every single month-end.
Rolling up portfolio financial forecasting isn't just about getting numbers to finance on time. It's about building a systematic bridge between how projects actually operate and how finance needs to report. When the cadence, data contracts, and roll-up logic are right, both teams can focus on their actual work instead of fighting over forecasts every single month-end.
Ready to elevate your project delivery?
Join over 2,500 project teams using GoProjy to optimize resources, reduce risks, and drive portfolio success.