

Most portfolio KPIs don't fail loudly. They rot quietly. A connector silently starts returning nulls for actualcost, a source system changes its status enum from In Progress to INPROGRESS, and three weeks later your steering committee is staring at a green portfolio that's actually bleeding. Nobody lied. The numbers just stopped meaning what everyone assumed they meant.
This post is narrow on purpose. It's about the plumbing underneath the dashboard — the portfolio KPI data health checks that catch drift before it reaches an exec deck. Not threshold tuning for the metrics themselves, but the checks that tell you whether the underlying data is still trustworthy enough to compute a KPI at all.
If you've already built a decent portfolio KPI data model and governance system, this is the layer that keeps it honest.
The specific failure: your KPI is "green" because the data stopped arriving
A KPI like Schedule Performance Index or % milestones on track gets computed from a roll-up. The roll-up reads from a staging table. The staging table gets fed by a nightly sync from Jira, Smartsheet, and a finance export. One of those feeds breaks — not catastrophically, just partially. Maybe the finance export now excludes closed cost centers. Maybe the Jira connector times out on large projects and quietly returns a partial result.
The roll-up still runs. It averages across whatever rows it did get. The KPI computes a number. The dashboard renders green.
What actually happened: you're reporting on 60% of the portfolio and calling it 100%. And because the missing 40% is usually the messy, late, over-budget stuff — big projects time out more, troubled projects have inconsistent data entry — the drift is biased toward looking good.
This usually happens right after an "invisible" change. A vendor pushes an API update, someone renames a field, a new project onboards with a slightly different template. No alarm fires because nothing is responsible for asking "is this data still shaped the way my KPI expects?"
Why drift slips past most PMOs
A few structural reasons this keeps happening:
Stop losing track of critical projects.
GoProjy helps you monitor, prioritize, and deliver projects on time—seamlessly.
- Unified portfolio visibility
- Real-time resource tracking
- Milestone & risk alerts
No credit card required
-
Dashboards validate presentation, not inputs. Your BI tool checks that the query returned rows. It does not check that the rows are complete, fresh, or semantically consistent with last week.
-
Nobody owns the gap between "data exists" and "data is correct." The connector team owns the pipe. The PMO owns the metric. The space in between — null rates, enum drift, row-count collapse — is orphaned.
-
Checks are built once, during setup, then never revisited. The feed that was clean at launch is not the feed you have 8 months later.
The fix isn't more dashboards. It's a small set of signal-first checks that run before the KPI is allowed to be considered valid — and a clear rule about who gets paged when one trips.
The four recipe categories
Everything below falls into four buckets. Keep them separate; they fail for different reasons and need different owners.
| Check type | What it catches | Typical trigger | Owner |
|---|---|---|---|
| Null-rate check | Fields silently going empty | Connector partial failure, schema change | Data pipeline owner |
| Source-drift detection | Row counts / distributions shifting | Source filter change, onboarding, outage | Data pipeline owner |
| Data-contract violation | Shape/type/enum breaking the agreed spec | API update, manual template edit | Source system owner |
| Freshness / staleness | Data not updating at all | Sync job failure, auth token expiry | Data pipeline owner |
Splitting these isn't just tidiness. When a check trips, the remediation playbook shouldn't have to guess who fixes it. Different failure types have different owners, and that distinction matters at 7:45am before a portfolio review.
Recipe 1: Null-rate checks
The simplest, highest-ROI check. You're not asking "are there nulls" — some nulls are normal. You're asking "did the null rate change?"
A field like baselinefinishdate might legitimately be 5% null for new projects that haven't been baselined yet. The signal is when it jumps to 30% overnight.
-- Null-rate check with a baseline comparison WITH currentrates AS ( SELECT COUNT() AS totalrows, SUM(CASE WHEN actualcost IS NULL THEN 1 ELSE 0 END) AS nullactualcost, SUM(CASE WHEN baselinefinishdate IS NULL THEN 1 ELSE 0 END) AS nullbaseline FROM staging.projectmetrics WHERE loaddate = CURRENTDATE ) SELECT ROUND(100.0 nullactualcost / totalrows, 1) AS pctnullcost, ROUND(100.0 * nullbaseline / totalrows, 1) AS pctnullbaseline FROM current_rates;
Then compare against a rolling baseline rather than a fixed threshold:
rule: nullratespike for each monitoredfield: current = nullrate(field, today) baseline = avg(nullrate(field, last14days)) if current > baseline + 10 percentagepoints: raise CONTRACTWARNING(field, current, baseline) if current > baseline + 25 percentagepoints: raise CONTRACT_BREACH(field, current, baseline)
The mistake people make here: setting a flat threshold like "alert if nulls > 20%." That either floods you with noise on fields that are naturally sparse, or misses a field that jumped from 2% to 18% — still inside the threshold but clearly broken. Baseline-relative beats absolute almost every time.
On which fields to actually monitor: don't monitor everything. Pick the 8–12 fields your KPIs directly depend on. For portfolio health that's usually status, % complete, baseline dates, forecast dates, actual cost, EAC, and owner. Monitoring 80 fields produces alert fatigue and nothing gets investigated.
Recipe 2: Source-drift detection
Null checks catch empty values. Drift detection catches the sneakier failure: the data is present but the population changed.
Classic example — a nightly feed drops from roughly 1,400 active project rows to around 870 because someone added a WHERE status != 'ON_HOLD' filter upstream. Every row is clean. Every null check passes. But you lost a third of your portfolio.
-- Row-count drift vs 7-day average WITH daily AS ( SELECT loaddate, COUNT(*) AS rows FROM staging.projectmetrics GROUP BY loaddate ), baseline AS ( SELECT AVG(rows) AS avgrows, STDDEV(rows) AS sdrows FROM daily WHERE loaddate BETWEEN CURRENTDATE - 8 AND CURRENTDATE - 1 ) SELECT d.rows, b.avgrows, ROUND((d.rows - b.avgrows) / NULLIF(b.sdrows,0), 2) AS zscore FROM daily d CROSS JOIN baseline b WHERE d.loaddate = CURRENTDATE;
If the z-score crosses roughly ±3, something moved. Also worth watching distribution drift on categorical fields — if status suddenly shows 40% in a value that was at 5% yesterday, a mapping probably broke.
rule: distributiondrift for status in [Red, Amber, Green, On Hold]: pcttoday = share(status, today) pctbase = avgshare(status, last7days) if abs(pcttoday - pctbase) > 15 percentagepoints: raise DRIFTWARNING(status)
This connects directly to low-noise early-warning trigger design — the same philosophy of using trends and variance bands rather than brittle fixed lines applies to data health, not just schedule signals. A check that cries wolf gets muted. A muted check is worse than no check because it creates false confidence.
Recipe 3: Data-contract violation rules
A data contract is a written agreement about the shape of data a source promises to deliver — types, allowed values, required fields, format. The violation rules enforce it automatically.
Where this earns its keep: the enum problem. Your KPI logic has WHEN status = 'Green'. The source system gets upgraded and now emits 'GREEN'. Your CASE statement silently drops every green project into the ELSE bucket. No error. Just quietly wrong.
-- Contract violation: unexpected status values SELECT status, COUNT(*) AS rows FROM staging.projectmetrics WHERE loaddate = CURRENT_DATE AND status NOT IN ('Red','Amber','Green','On Hold') GROUP BY status; -- any rows returned = contract breach
A compact contract spec you can keep in version control:
field: status type: string required: true allowedvalues: [Red, Amber, Green, On Hold] onviolation: BREACH field: percentcomplete type: decimal required: true range: [0, 100] onviolation: BREACH field: forecastfinishdate type: date required: true notbefore: baselinestartdate onviolation: WARNING
Contract violations are almost always upstream problems, which is exactly why the owner column in that earlier table matters. A null-rate spike might be a pipeline hiccup you can fix with a rerun. A contract violation means a source changed and the fix belongs with whoever owns that system — not the PMO analyst who happened to notice the dashboard looked off.
Recipe 4: Freshness checks
The quiet killer. Everything looks normal because yesterday's data is still sitting there — the sync just stopped running.
-- Staleness check per source SELECT sourcesystem, MAX(lastupdated) AS latest, EXTRACT(EPOCH FROM (NOW() - MAX(lastupdated)))/3600 AS hoursstale FROM staging.sourcesynclog GROUP BY sourcesystem HAVING EXTRACT(EPOCH FROM (NOW() - MAX(lastupdated)))/3600 > 26;
Set the staleness window a little wider than your sync interval — a daily sync gets ~26 hours, not 24, to absorb normal jitter. An expired OAuth token is the single most common cause here, and it fails in exactly the way that's hardest to notice: last known good data persists, dashboard stays green, nobody updates anything for days.
Remediation playbooks: what happens when a check trips
Catching drift is half the job. The other half is a pre-written response so the person who gets the alert isn't improvising at 8am before a portfolio review.
Keep playbooks small and tied to severity. Two levels is enough: WARNING (investigate, KPI stays live but flagged) and BREACH (KPI suppressed or marked unreliable until resolved).
-
Auto-flag the KPI. Any KPI consuming
actual_costrenders with a "data unreliable" badge instead of a confident number. This alone prevents the biggest harm — someone making a funding call on broken data. -
Pin the blast radius. The alert lists which KPIs and which projects are affected, so nobody debates scope.
-
Route to the owner. Null-rate breach → pipeline owner, not the source owner. Routing is decided by check type, not by whoever's nearest.
-
Check the obvious first. Rerun the sync. Partial-failure nulls often clear on a clean rerun.
-
If rerun fails, escalate to the source owner with the exact field, the baseline rate, and the breach rate attached. No "the data looks off" messages.
-
Log the incident. Date, check, root cause, fix. That's how you stop the same break recurring every quarter.
-
Clear the flag only after the check passes, not after someone thinks it's fixed.
Step 1 — suppress rather than show — is the part most teams skip and most regret. A flagged KPI prompts a question. A silently wrong green KPI prompts a bad decision.
Ownership rules, kept simple
-
Pipeline owner fixes anything that's a transport problem
nulls from partial loads, staleness, row-count drops from job failures.
-
Source system owner fixes anything that's a shape problem
enum changes, missing required fields, type changes, range violations.
-
PMO metric owner owns the contract itself — deciding which fields matter, what the allowed values are, and what severity each violation gets.
Write these three down next to the contract spec. When an alert fires, there should be zero debate about whose Monday just got interesting.
A real scenario
A mid-sized infrastructure PMO — roughly 40 active projects across four delivery teams, reporting a weekly portfolio health pack to an exec committee.
Their actual_cost feed came from a finance export. During a quarter-end reconfiguration, finance changed the export to exclude capitalized line items. No notice to the PMO. For about three weeks, the portfolio EAC roll-up looked better than reality — somewhere in the range of 12–15% under actual committed spend, because a whole category of cost just wasn't arriving. Every dashboard was green. The weekly pack said the portfolio was tracking under budget.
It surfaced the hard way: a project director questioned why her project's reported spend was far lower than her own ledger. By the time they traced it, two funding decisions had already been made on numbers that were quietly wrong.
After the incident they added two checks: a row-count drift check on the finance feed (which would have caught the dropped line-item category on the first load) and a null/completeness check against expected cost-center coverage. Nothing elaborate — a handful of SQL checks running after each load, with a BREACH rule that suppressed the EAC KPI until coverage was restored. The next time finance changed an export — about five months later — the check tripped immediately and the KPI showed "unreliable" instead of a false green. The fix took an afternoon instead of three weeks.
The ROI here isn't a dashboard metric. It's the funding decision you didn't make on bad data.
When this makes sense — and when it doesn't
Worth building when:
-
You have more than a handful of projects feeding from multiple sources.
-
KPIs drive real decisions — funding, reprioritization, escalation.
-
You've already been burned by a silently wrong number (most PMOs have, they just don't always catch it).
Probably overkill when:
-
You have one source of truth, manually maintained, and you'd notice anomalies by eye.
-
Your portfolio is small enough that an analyst reviews every project weekly anyway.
Who should NOT start here: if your KPI definitions are still unstable — people still arguing about what "on track" even means — fix that first. Health checks enforce a contract. You can't enforce a contract nobody's agreed to. Get the KPI data model and governance settled, then layer these checks on top.
Where tooling fits — lightly
You can run all of this with scheduled SQL and a couple of alert routes. That's a perfectly reasonable starting point and plenty of PMOs never need more than that.
Where a proper operational platform earns its place is when the number of checks grows and the manual overhead starts to bite — keeping baselines current, routing alerts to the right owner automatically, suppressing affected KPIs without hand-editing dashboards, and maintaining an incident log that doesn't depend on someone remembering to write it down. AI-assisted monitoring is genuinely useful for the baseline-learning part: figuring out what "normal" null rates and row counts look like per feed, so you're not hand-tuning dozens of thresholds and re-tuning them every time the portfolio shape changes. That's the tedious, error-prone work worth handing off. The checks themselves, though, are simple enough that you should build and understand them before automating anything.
A note on check sequence
One thing worth being deliberate about: the order in which these checks run matters. Freshness should go first. If the sync didn't run, every downstream check is noise — you'd be comparing today's stale data against yesterday's baseline and potentially raising null-rate alerts that don't reflect a real problem.
A reasonable sequence looks like this:
-
Freshness check — confirm new data actually arrived before anything else runs.
-
Row-count drift — verify the population is roughly what you'd expect.
-
Null-rate checks — now that you know the data is fresh and complete-ish, check field-level integrity.
-
Contract violations — shape and enum checks run last, once you've confirmed there's actually something worth validating.
This sequence also makes incident investigation cleaner. If freshness trips, you stop there. If row-count trips but freshness passed, you know it's a population problem, not a sync problem. Keeping the checks independent but running them in order saves a lot of confused back-and-forth when something breaks at an inconvenient time.
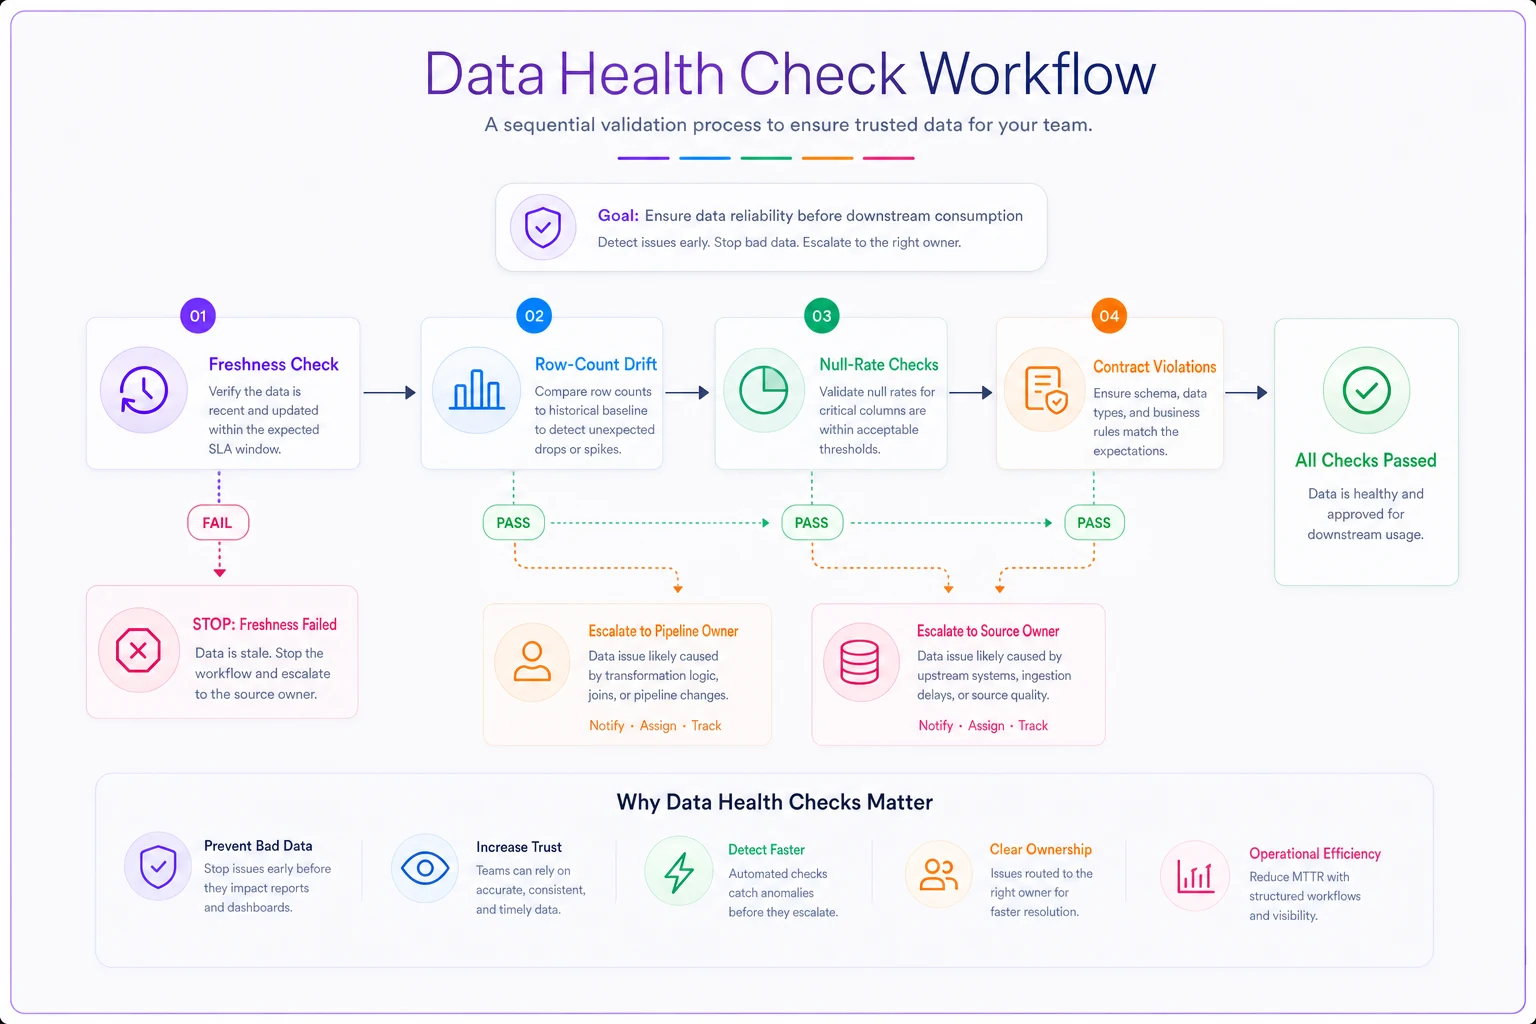
The diagram above shows the recommended order and decision points for running checks and routing alerts.
Closing thought The reason KPI drift is so dangerous isn't that the data breaks. Data breaks constantly — connectors fail, schemas change, exports get reconfigured. The danger is that a broken feed produces a confident number instead of an error. Green dashboards don't prompt questions. Signal-first checks flip that. They make the system admit when it doesn't know something. A KPI that says "unreliable — coverage dropped to 68%" is doing its job. A KPI that says "Green" while quietly missing a third of the portfolio isn't a KPI — it's a liability with a nice color scheme. Build the checks, assign the owners, write the playbooks, and let your dashboards earn the trust people already give them.
Ready to elevate your project delivery?
Join over 2,500 project teams using GoProjy to optimize resources, reduce risks, and drive portfolio success.